IncuCyteZOOM: Features and Applications of the Second Generation of Long-Term Dynamic Live Cell Imaging and Data Analysis Systems (Second Edition)
2023-02-25 08:08:36
At present, most of the cell detection methods still use the traditional end point method - just give the final result, and often need to label cells and destroy cells. This method does not provide the true state of the cell as it grows, nor does it allow for dynamic monitoring and analysis of the cell's growth process. Essen Corporation of the United States has developed the second generation of long-term real-time dynamic live cell imaging analyzer, IncuCyteZOOM , which uses a non-invasive method to record the real-time growth status of living cells and perform quantitative analysis while imaging. This imaging method, called Quantitative Live-cell Imaging, eliminates the need to set up experimental endpoints, performs real-time imaging and quantitative analysis while cultured, and provides a variety of application modules for remote control. Expands the way users record and understand cell morphology, cell growth and cell behavior.
Essen's IncuCyteZOOM is a long-term, real-time dynamic, non- invasive live cell imaging analysis platform. The instrument is divided into two parts: a microscopic imager and a controller. The microscopic imager can be placed in an incubator with standard consumables of various sizes (plates, dishes, bottles and slides) placed underneath. With photomicrography equipment, continuous monitoring of cultured cells through autofocus and automatic shooting, and remote control, data reading and analysis through a networked computer. The system automatically collects phase contrast images and red/green fluorescence images at each time point. In addition to images or dynamic recordings in various formats, users can also obtain image data-based charts generated by the system software based on coverage (Confluence, translation into saturation, saturation) and count analysis (Cell Count). To show changes and trends in cells. The coverage vs. time plot of cell proliferation is shown, showing the relative wound density versus time plot of the scratch test, the vessel length vs time plot of the neovascularization, or the neurite length vs time plot showing the nerve growth.
The IncuCyte objective lens can be selected from 4×, 10×, 20× and can be replaced by the user. Full-hole imaging can be performed on a 6-384-well microplate under a 4x objective. The connector for the objective lens can also be installed with a Marking Tool. It can be physically marked on the bottom of the container by software operation, which is convenient for subsequent experimental observation, as shown in Figure 2.
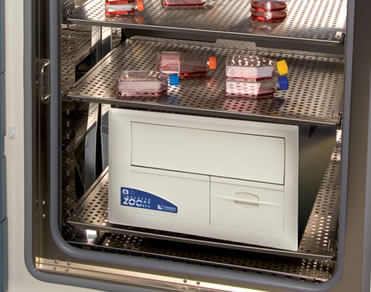
Figure 1: IncuCyte ZOOM in the incubator
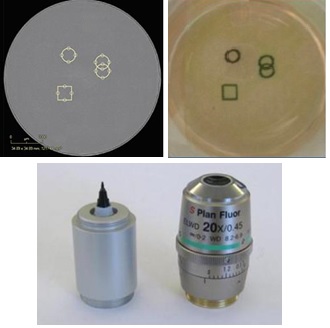
Figure 2: Top left: Software mark, top right: Physical mark on the bottom of the dish with a marker, below: marker and objective
The advantages of IncuCyte are as follows:
1) The cultured cells are directly monitored by high-resolution phase contrast microscope or fluorescence microscope, which is non-destructive monitoring. The cells can be observed and monitored without staining, and the image effect is good;
2) The culture environment is provided by a commercial incubator. During the monitoring process, the cells do not need to leave the incubator, and there is no need to worry about the influence of changes in culture conditions on the cells;
3) Real long-term dynamic live cell imaging, which can last for weeks or months;
4) High-definition phase contrast imaging can eliminate the meniscus defects of the microplate, and without the halo problem of the traditional microscopy system, the cell morphology can be monitored in a 384-well plate;
5) The image processing software automatically quantifies cell proliferation based on coverage and count analysis, and automatically outputs cell growth curves and IC50 and EC50 values;
6) Real-time monitoring can change the traditional “end point method†experimental method, which is rich in data, more accurate and more flexible;
7) High-throughput, can monitor 6 standard cell culture plates/dishes/bottles at the same time, and the cells can be tested in 384-well plate, which can reduce the precious drug consumption, see Figure 3;
8) Support more than 200 standard culture vessels without special culture vessels, saving the cost of later experiments;
9) Remote monitoring, data reading and analysis, no need to repeatedly enter and exit the cell room, avoiding the potential pollution hazards and the trouble of manual access.
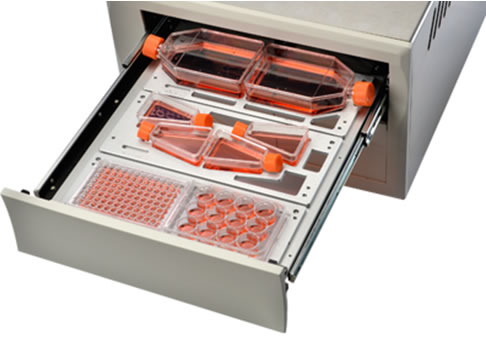
Figure 3: IncuCyte internal structure, supporting more than 200 standard culture vessels, can simultaneously observe up to 6 microplates
Figure 4 is a high-resolution phase contrast image of cell proliferation and a proliferation curve of coverage vs. time recorded by IncuCyte, and yellow is a software-to-segment display of cell images. IncuCyte also generates a proliferation curve for cell number vs. time for fluorescent images. The final image will be exported as a separate JPEG file or video.
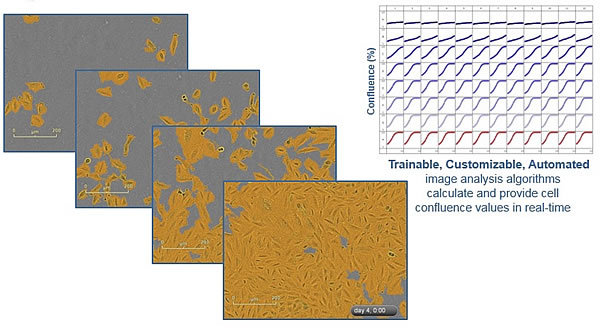
Figure 4: Phase contrast image and proliferation curve of cells recorded by IncuCyte
The main software features of IncuCyte:
1) The user can control the instrument on any networked computer without having to repeatedly take in and take out the specimen and enter and exit the cell room, which makes IncuCyte a “virtual incubatorâ€.
2) One of the best features of IncuCyte is the intuitive software interface design. The user can define the type of consumables, the time of shooting, the position and the number of fields of view on the software interface, as shown in Figure 5.
3) Support to insert other shooting tasks during long shooting to continue shooting to make full use of the instrument.
4) IncuCyte can autofocus and automatically collect images. Display control of brightness, size, and contrast can also be performed on the obtained image. Parameters such as cell size and eccentricity can be set to filter background impurities.
5) The user can customize the sample information, perform group analysis, and electronically mark the container, set keywords, and search the database with the set keywords if necessary, to conveniently search for images and data obtained at any time in the past.
6) Users can also capture images, charts and curves directly from the software to Word, Excel, PowerPoint and Email. All generated data can be archived, and the data and charts can be packaged and sealed for easy retrieval.
7) New features of IncuCyte ZOOM include multi-fluorescence image processing module and new phase difference imaging processing module.
8) ZOOM has also designed a new database that makes it easier for users to find and retrieve experimental data.
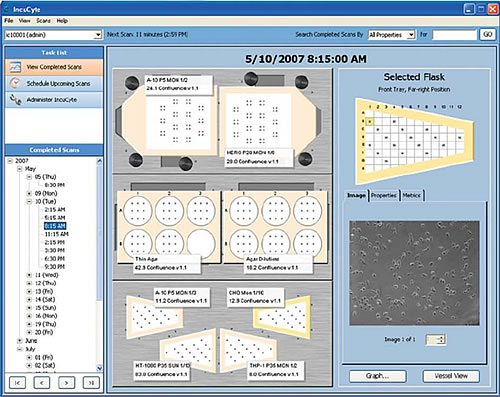
Figure 5: Software operation interface
The basic applications of IncuCyte include (no kit required):
1) Monitoring cell proliferation (Proliferation): non-invasive, quantitative analysis of cell proliferation by real-time dynamic imaging;
2) Cell Culture QC/Cell Culture Optimization: Dynamic growth curve based on cell coverage and cell number can be generated by real-time dynamic imaging;
3) Monitoring Cytotoxicity: mixing dyes and cells and monitoring them, the operator can leave, is a dye-based experiment;
4) Monitoring apoptosis (Apoptosis): mixing the apoptotic reagent with the cells and monitoring, the operator can leave, is a dye-based experiment;
5) Reporter Gene: Label cells with fluorescent proteins, and the cells can be obtained without real-time dynamic data.
6) Stem Cell Monitoring & Reprogramming: The whole process of stem cell growth and reprogramming can be monitored in real time;
7) Dilution Cloning: The whole process of growing single cells into clones can be tracked in real time;
8) Three-dimensional tumor sphere imaging (3D-Spheroid): can automatically calculate the growth and contraction of 3D tumor spheres, and dynamically quantify the sphere parameters in real time;
9) Immune Cell Killing: Real-time dynamic observation and analysis of immune cell-mediated killing of tumor cells;
10) Immune Cell Clustering and Proliferation: Real-time dynamic observation and quantitative analysis of aggregation and proliferation of immune cells.
IncuCyte has developed a number of kits for special applications with specially designed quantitative analysis software. Applications that require a kit include:
1) Cell Migration/Cell Invasion: A well-consistent 96-well wound scratching tool, Wound Maker, monitors the wound healing process in real time and obtains quantitative indicators of cell migration. ;
2) Monitoring Chemotaxis: A special 96-well plate was used to quantitatively analyze the cell migration (Migration) movement of adherent cells and suspension cells under the action of chemokines.
3) Monitoring Angiogenesis: Using a validated angiogenesis kit with a quantitative analysis of dynamic analysis of angiogenesis;
4) Kinetic NeuroTrack: Quantitative analysis of neurite outgrowth of neuronal cells based on phase contrast and fluorescence imaging, respectively.
Below we focus on basic applications (cytotoxicity, apoptosis, reporter gene, stem cell growth, dilution cloning, three-dimensional tumor sphere imaging, immune cell killing, immune cell aggregation and proliferation) and the need for kits (cell migration, cell invasion, Chemotaxis, angiogenesis, and nerve tracking). The principle of cell proliferation, culture quality control, and cell culture optimization can be seen in Figure 4.
IncuCyte's main application without kits:
(a) Monitoring cytotoxicity (Cytotoxicity)
When cytotoxicity occurs, the cell membrane ruptures, and cytotoxic cells can be stained with a non-permeable dye such as YOYO-1 or CellTox Green, and then observed with IncuCyte.
Key features: 1) Label healthy cells with NucLight Lentiviral reagent, label toxic cells with cell-impermeable DNA dyes, and monitor cell proliferation and cytotoxicity; 2) Cytotoxicity and Cytostatic; 3) Data can be exported to third-party software to calculate EC50 and IC50; 4) High-resolution phase difference images of 4×, 10× or 20× can be obtained to track cell morphology and confirm whether cells are dead; 5) Process-free Mix the dyes and then read them; 6) Observe the toxic effects of various compounds and drugs on the cells.
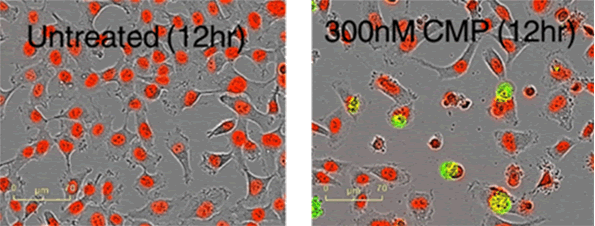
Figure 6: HT-1080 cells were labeled with NucLight-Red and treated with Camptothecin in the presence of YOYO-1. High definition phase contrast images and fluorescence images are used to confirm cell death.
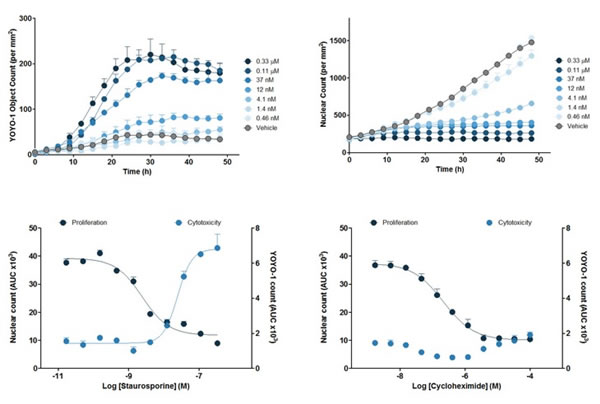
Figure 7: Top two panels: The sequential process of staurosporine on red fluorescent protein-labeled HT-1080 cells. The upper left panel shows the number of YOYO-1 labeled cell deaths over time; the upper right panel shows the red fluorescent protein labeled cell proliferation over time. The next two figures: the area under the curve (AUC) of the above two figures, the lower left picture shows the cytotoxicity and proliferation under the action of staurosporine, the lower right figure shows the cytotoxicity under the action of cycloheximide. proliferation. Cytotoxicity is expressed as the number of YOYO-1 labeled cells per square millimeter, and cell proliferation is expressed in number of red nuclei per square millimeter. The area under the curve (AUC) was used to calculate IC50 values ​​and EC50 values.
(B) monitoring apoptosis (Apoptosis)
The CellPlayer Caspase 3/7 Apoptosis Reagent is a linker for DNA dyes and substrates for the Caspase 3/7 enzyme. If the cell undergoes apoptosis in the Caspase 3/7 pathway, when the reagent is added to the medium, the activated Caspase 3/7 enzyme on the cell membrane degrades the linker, allowing the previously non-luminescent dye to detach from the linker, The DNA double-stranded of the cells binds to yellow-green fluorescence and is detected by IncuCyte. This allows you to observe the entire process of apoptosis in cells using IncuCyte.
Key features: 1) Label healthy cells with NucLight Lentiviral reagent, label apoptotic cells with Caspase 3/7 reagent, and monitor cell proliferation and apoptosis; 2) Add Caspase 3/7 reagent directly to the cells, no-wash operation To detect apoptosis caused by internal or external pathways; 3) Export data to third-party software to calculate IC50 and EC50. 4) Observe high-resolution phase contrast images with 4×, 10× or 20× objectives. To determine the death of cells; 5) high-throughput, 96- and 384-well plate experiments, 6 microplates per observation; 6) observation of the effects of various compounds and drugs on apoptosis .
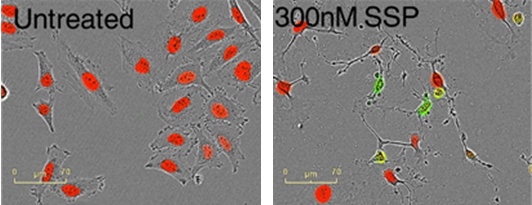
Figure 8: Red fluorescent protein-labeled cervical adenocarcinoma cells were treated with different concentrations of staurosporine (SSP) under conditions of Caspase 3/7 reagent. The number of red nuclei and the number of green fluorescence can be accurately measured. It is observed that green fluorescence accompanying Caspase 3/7 causes apoptosis of cells such as shrinkage and membrane blistering.
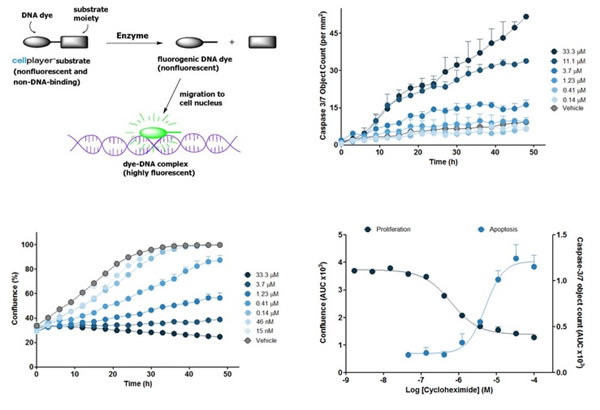
Figure 9: The top left image shows the principle of the Caspase 3/7 reagent. The other three sheets represent timing plots of different concentrations of cycloheximide in the treatment of HT-1080 human fibroblast cells. The upper right panel shows apoptosis expressed by the number of Caspase 3/7 green fluorescence per square millimeter, and the lower left panel shows cell proliferation expressed by coverage (Confluence). The lower right panel shows the concentration response curves of apoptosis and proliferation obtained from the area under the curve (AUC) in the previous two figures. The average AUC can be used to calculate the EC50 and IC50.
(3) Monitoring Report Gene (Reporter Gene)
The cells were transfected with a GFP/RFP-containing vector, and the promoter to be studied was inserted upstream of the GFP/RFP. In this way, IncuCyte can be used to observe the fluorescence intensity of fluorescent expression of GFP/RFP and the number of fluorescent cells, thereby monitoring the effect of pathway stimulation (such as NF-κB), promoter activity or reporter gene expression activity.
In contrast to the traditional endpoint luciferase method, the key features of IncuCyte are: 1) data rich: 96- or 384-well real-time dynamic data can obtain insights that are not available in the endpoint method; 2) cost savings: no need for lysis, no need The luciferase method requires a terminal reaction substrate, saving time and cost; 3) Convenience: Real-time dynamic readings allow the user to optimize the signal window in a single experiment without prior decision on when to terminate the experiment; 4) Sensitive: available per Multiple time point data under different conditions increase the quantification and stability of the experiment; 5) Customizable: The user can customize the promoter according to the needs, modify the reaction system, and monitor the effect of the drug on the reporter gene.
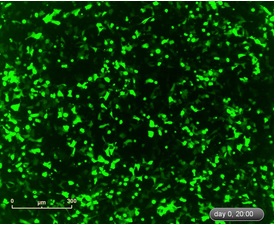
Figure 10: Fluorescence images of HEK293 cells transiently transfected with the commercial reporter gene (pNF-κB-rhGFP) photographed after treatment of cells with rhTNF-α (11 ng/ml) for 20 hr.
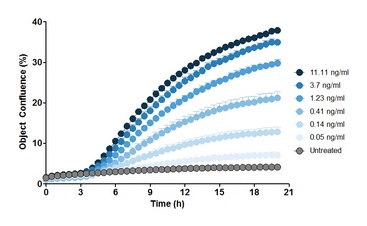
Figure 11: Expression of NF-κB-driven rhGFP reporter gene after stimulation of HEK293 cells with rhTNF-α (n=5 wells). In HEK293 cells transfected with the pNF-κB-rhGFP reporter gene, treatment with 3-fold dilution of rhTNF-α was performed. Images were taken at intervals of 15 min. The image indicates that the higher the concentration of the external rhTNF-α, the greater the fluorescence coverage of the cells, indicating that the activity of NF-κB inside the cells is stronger.
(iv) Stem Cell Monitoring & Reprogramming
The reprogramming and differentiation of stem cells can be monitored, and high-resolution phase contrast images can be used to confirm and track the formation of clones, which can be traced back to previous images.
Key features: 1) High-definition phase contrast images can be used to confirm and track the formation of clones without taking them out of the incubator, full-hole imaging to observe the edges of the wells; 2) monitoring and calculation of transduction efficiency and reprogramming efficiency; 3) The software can be used to mark the bottom of the container with a marker to locate and track the clones; 4) Reduce labor costs and improve work efficiency.
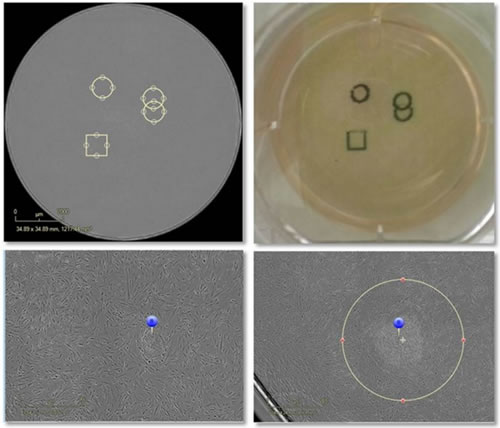
Figure 12: The upper left image shows the electronic marker of the area of ​​interest, and the upper right image shows the physical marker on the bottom of the culture dish with a marker. The image on the left is the mark of the emerging clone, and the picture on the right is the physical selection of the clone by software.

Figure 13: Tracking the formation of clones using high-resolution phase contrast imaging
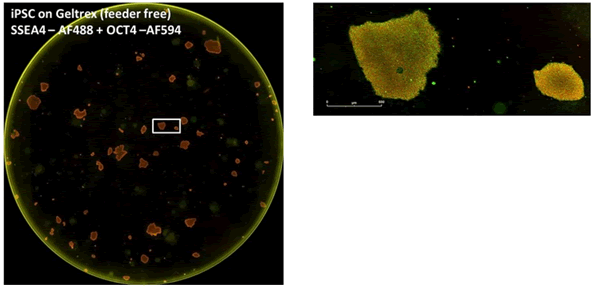
Figure 14: Confirmation of pluripotency with cell surface markers. Induced pluripotent stem cells derived from adult dermal fibroblasts were grown on murine embryonic fibroblast feeder cells, and pluripotency was confirmed by double labeling. The double labeling is: "SSEA4 primary antibody + Alexa Fluor 488 secondary antibody" and "OCT4 primary antibody + Alexa Fluor 594 secondary antibody". The upper left image shows the full-hole image, and the upper right image shows the selected clones in the full-hole image, which both express the pluripotency of the two cells.
(5) Dilution Cloning
For full-hole unlabeled images, auto-scan clones to confirm monoclonal status, integrated image processing software can identify wells containing emerging clones and quickly identify clones of interest.
Key features: 1) From the desk, you can quickly browse the consumables and 96-well plates to confirm the clones without having to observe them with a microscope; 2) use sequential images to confirm that the clones are derived from a single cell; 3) high-definition phase contrast imaging It can generate full-hole images from 96-well plates to 35mm culture dishes, and the edges of the wells can be clearly seen; 4) can automatically identify the wells containing the clones, and can identify the clones with the clone marker tool; 5) can perform the clones Quickly incubate and expand and obtain cloned growth indicators.
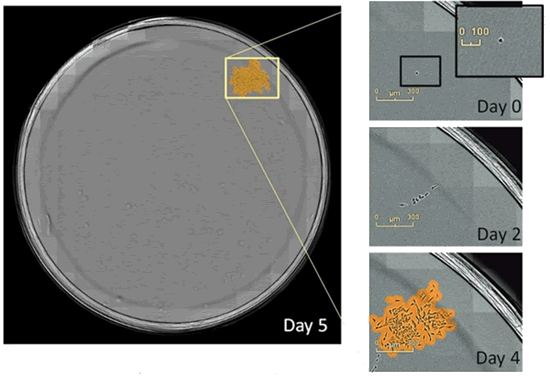
Figure 15: Quickly scan, locate, and monitor clones with IncuCyte software to track their changes over time. The clones in the above figure are formed from a single cell.
(6) Three-dimensional tumor sphere growth (3D-Spheroids)
IncuCyte tracks and quantifies the formation, growth and contraction of non-adherent three-dimensional tumor spheres.
Key features: 1) Simple 96- or 384-well protocol, using low-cost, round-bottom, low-adsorption microplates; 2) Software can automatically acquire and analyze images, data can be exported to calculate EC50 and IC50; 2D and 3D experiments can be performed in parallel in the same well with the same reagent; 4) Monitoring and measuring the growth and contraction of tumor spheres over time using fluorescence area or fluorescence intensity; 5) Culture supernatant can be used for measurement ATP, lactic acid or other substance concentration.
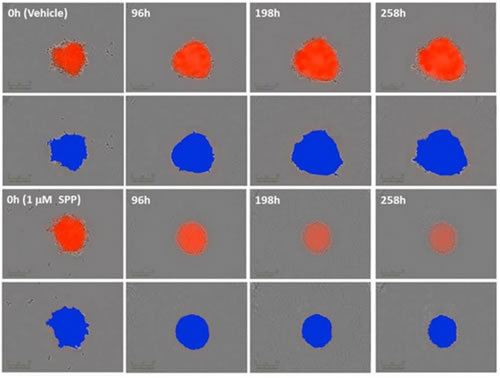
Figure 16: Time-series images showing growth and shrinkage of A549 human adenocarcinoma cells stably expressing nuclear RFP (A549 NucLight Red). Tumor spheres were divided into a blank control group and a staurosporine treatment group (t=0 on the third day after cell inoculation, treated with 1 μM Staurosporine, SPP). The red image is a superposition of a high definition phase difference image and a fluorescence image. The control group showed an increase in the size and fluorescence intensity of the tumor sphere, and the size of the SPP-treated tumor sphere shrunk and the fluorescence became dark. The blue image is a pseudo color for machine analysis.
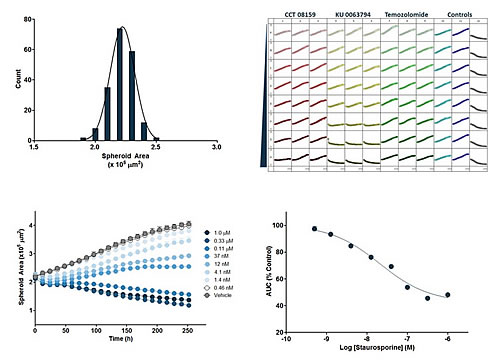
Figure 17: Top left panel: Size column chart, 192 (2 96-well plates) A549 NuLight Red tumor spheres at t = 0 (three days after cell inoculation) area (square micron). Upper right panel: microplate map, the proliferation timing curve of the tumor sphere treated with the experimental reagent (three replicates), starting from t=0 for 10 days. The abscissa is time (h) and the ordinate is fluorescence coverage (%). Bottom left: Time series curve of cells treated with different concentrations of staurosporine (SPP). The abscissa is time (h) and the ordinate is the fluorescence area (square micron) of the tumor sphere. Bottom right: SPP concentration response curve: The area under the curve (AUC) of the lower left image is analyzed. The abscissa is the logarithm of the SPP concentration and the ordinate is the AUC of the fluorescence area of ​​the tumor sphere.
(7) Immune Cell Killing
The ability of immune cells to recognize and kill tumor cells is one of the key components of human host defense mechanisms. Antibody-based cell-mediated cytotoxicity (ADCC) and T cell killing are two functions of cell-mediated immune responses. Both of these processes include stimulation of immune cell populations (such as natural killer cells NK or cytotoxic T lymphocyte CTL) followed by active lysis of target cells. Understanding the interaction between immune cells and cancer cells, maintaining and promoting the immune system's ability to fight and eliminate tumor cells is one of the hotspots of current research ("cancer immunotherapy" or "immune oncology").
Key features: 1) Co-culture of target tumor cells and immune cells (such as T cells, human peripheral blood mononuclear cells, PBMCs); 2) Direct detection of tumor cell death by the addition of no-clean Caspase 3/7 apoptosis reagent; Automatic image analysis can selectively quantify tumor cell death. Tumor cells can be labeled and counted by NucLight Live-Cell lentiviral labeling reagent to calculate tumor cell proliferation. 4) Real-time imaging can reveal immune cells and cancer Dynamic interaction between cells can analyze cell morphology; 5) No-wash 96/384 experimental design, suitable for drug screening.
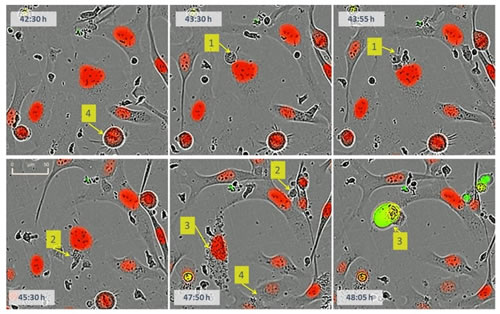
Figure 18: Dynamic observation of the interaction of immune cells and tumor cells. Mark 1: a small cytotoxic T cell and a larger labeled tumor cell (red) physical contact; marker 2: tumor cells are attacked by cytotoxic T lymphocytes; marker 3: tumor cell nucleus Granular, then immediately stained with Caspase 3/7 reagent (green), nuclear condensation, cell death; marker 4: tumor cells undergo mitosis, one cell becomes two.
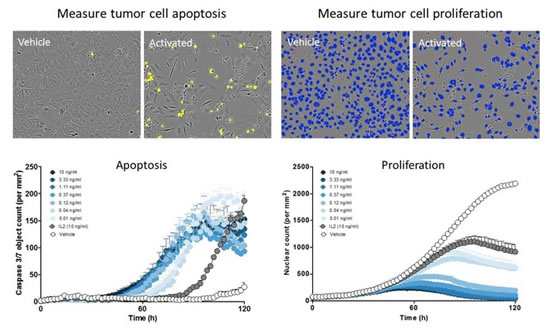
Figure 19: Real-time dynamic measurement of tumor cell death and proliferation. IncuCyte software directly detects apoptotic tumor cells (green subjects, pseudo-yellow) and counts live tumor cells in real time (with NucLight red labeled nuclei, pseudo-color is blue). Real-time dynamic data analysis reveals the timing effects of drugs.
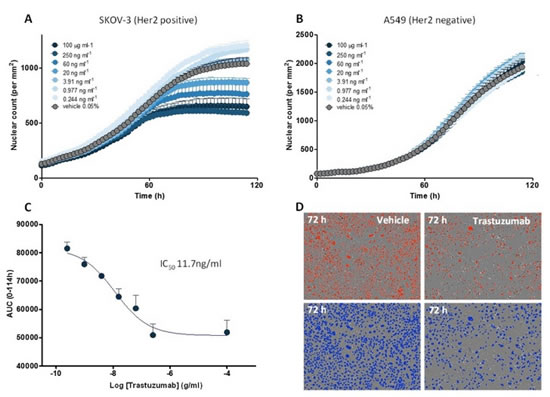
Figure 20: ADCC (antibody-mediated cell-mediated cytotoxicity): Tracnuzumab (Herceptin)-induced killing of SKOV-3 ovarian cancer cells by immune cells. PBMCs were co-cultured with SKOV-3 NucLight Red (Her2 positive) or A549 NucLight Red (Her2 negative) tumor cells. (A): concentration-based proliferation inhibition induced by trastuzumab in SKOV-3 tumor cells; (B): A549 does not undergo concentration-based inhibition of proliferation. (C): Concentration response curve of trastuzumab against proliferation inhibition of SKOV-3 cells. (D): Images of added and unimmunized images, above: untreated, lower panel: cells were marked with blue pseudo-color, all were imaged after 72 h of drug addition.
(8) Immune Cell Clustering and Proliferation
In an immune response, cells activated in the immune system, such as T lymphocytes, rapidly proliferate to fight infections and diseases. Interactions also occur between activated immune cells (such as the interaction between T cells and antigen-expressing cells, the interaction of T cells, etc.). Dynamic changes in the number of these cells and cell-cell interactions are the basis for regulating the effects and extent of immune responses. Understanding the function of immune cell activation, proliferation and regulation is the key to developing new and highly effective anti-tumor immunotherapy.
Key features: 1) Real-time dynamic observation and automatic quantitative analysis of immune cell interaction and proliferation; 2) Monitoring of cell behavior in the incubator; 3) Dynamic measurement without labeling cells; 4) No-wash operation No need to suspend cells, no need to label antibodies; 4) Observe and calculate the effects of drugs on immune cell aggregation and proliferation; 5) Compatible with traditional flow cytometry methods and endpoint biochemical methods, collected after IncuCyte experiment The cells or supernatant can be used.
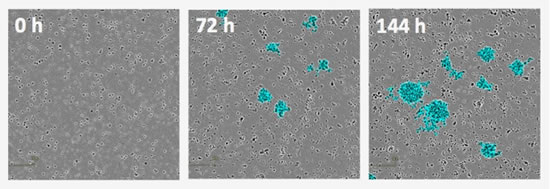
Figure 21: Non-labeled detection of aggregation of T cells. Activation of PBMCs with anti-CD3 antibodies and IL-2 induces aggregation or "clustering" of T cells. IncuCyte software accurately quantifies the accumulation of cells over time (blue pseudo-color in the picture).
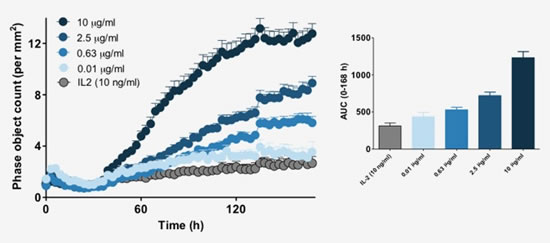
Figure 22: Calculating real-time dynamic cell aggregation. Automated time series analysis reveals the effects of drug treatment. Increasing the concentration of the anti-CD3 antibody from 0.01 to 10 μg/ml in the presence of IL-2 (10 μg/ml) promoted aggregation of T cells.

Figure 23: Real-time label-free monitoring of proliferation of PBMC. Left panel: IncuCyte automates the proliferation of PBMCs activated with anti-CD3 antibody and IL-2 (yellow pseudo-color). Right panel: Time series curve of proliferation of PBMCs under three conditions.
The main applications of IncuCyte's Need Kit:
(9) Monitoring of cell migration (Scratch Wound Cell Migration)
IncuCyte's Migration module is the only commercially available 96-hole scratcher (WoundMaker Tool) that produces 96 uniform scratches on a 96-well microplate with just one button, and then uses IncuCyte to record The real-time dynamic process of Wound Healing.
IncuCyte can get images from preset time points and convert them into videos. The system records the initial Wound Mask, and then with the generation of the Revised Wound Mask, the system continuously records the image to track the healing of the scratch. Users can visually observe changes in cell morphology through 2D migration and 3D invasion images, and compare the two cell movement patterns. Based on our high-definition imaging, cells can be viewed without marking. Using a proprietary algorithm, a comprehensive time-lapse-based continuous image acquisition metric can be obtained, including: Relative Wound Density, Wound Confluence, Wound Width, used to calculate EC50 and IC50, mobility, makes the experimental results more quantitative and reproducible. Indicators at all time points can be verified by cell images and video.
Key features of cell migration: 1) 2D cell migration and 3D cell invasion can be measured by a 4×, 10× or 20× objective in the same 96-well microplate and compared; 2) at each time Points can generate 576 wells (6×96); 3) Quantitative determination of non-labeled cell migration in more than 30 different primary and immortalised cells, including HUVEC Cell and tumor cell lines; 4) Automated analysis of relative wound density, wound coverage and wound width; 5) Validation of pharmacological effects with images and time series recording; 6) Labeling of cells with NucLight or CytoLight RFP/GFP for quantitative monitoring Cultured cells migrate and invade.
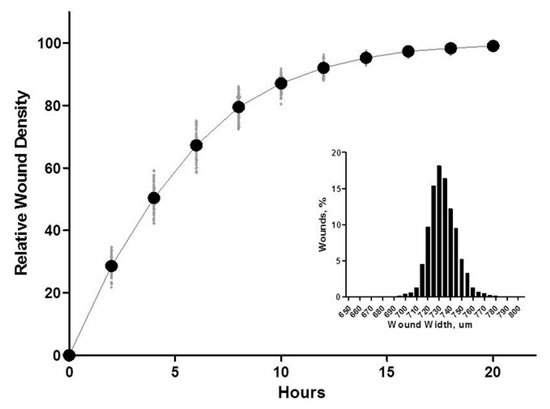
Figure 24: Left panel: Migration curve of HT-1080 human fibrosarcoma cells with abscissa in time (h) and ordinate as mean of 96 well RDW (%). The right panel shows the cell invasion image in 8 mg/ml Matrigel; the right panel: the distribution of the initial wound width of 96 scratches of HT-1080 cells, indicating that the wound width is substantially uniform.
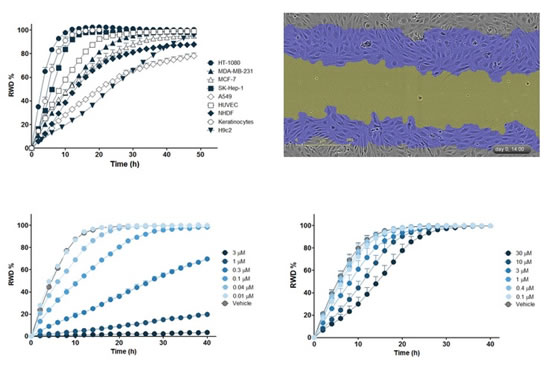
Figure 25: Top left panel: Comparison of migration motion curves for different cell lines, the abscissa is time (h), and the ordinate is relative wound density (RWD, %, RWD = 0 indicates no migration occurred). Upper right panel: Phase contrast images after 14 hours of HUVECs cell migration. The blue area indicates the area covered by cell migration in 14 h, and the yellow area indicates the Wound Mask area after 14 h. Bottom left: Migration movement curve of HT-1080 cells treated with different concentrations of cytochalasin D (Cytochalasin D). Bottom right: Migration movement curve of HT-1080 cells treated with different concentrations of wortmannin. The abscissa is time (h) and the ordinate is RWD (%). Note: The cell migration curves obtained by the two drugs are different.
(10) Monitoring of cell invasion (Scratch Wound Cell Invasion)
The cell invasion and cell migration of the scratch test have similar experimental procedures, the difference is that the cell species of the cell migration are on the extracellular matrix (ECM), and the culture is observed directly after the wound is drawn; and the cell species invaded by the cell On the ECM, a wound is placed and a layer of ECM is placed and cultured for observation. Therefore, cell migration is carried out in a 2D environment, and cell invasion is carried out in a 3D environment.
Key features of cell invasion: same cell migration.
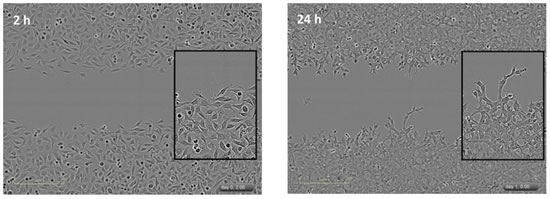
Figure 26: Left panel: Phase contrast images of HT-1080 human fibrosarcoma cells migrated on Matrigel (100 μg/ml) for 2 h. Right panel: Phase contrast images of HT-1080 cells in a Matrigel (8 mg/ml) for 24 h. Note that there is a large difference in cell morphology between the two cases, and the invasive image also shows the path of a single cell through Matrigel.
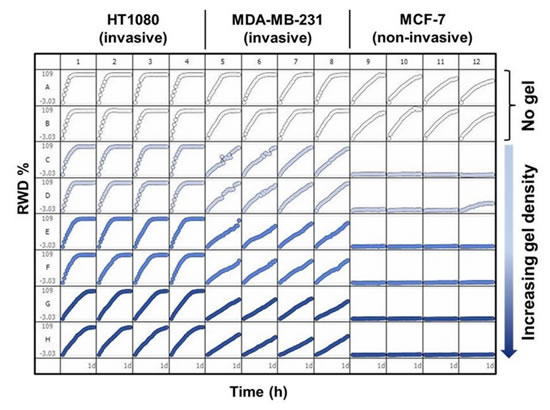
Figure 27: The top panel shows migration of three cells on Collagen-1 primer (300 μg/ml) and invasion in Collagen-1 matrix (0, 1, 2, 3 mg/ml). Please note: MCF-7 human thymic cancer cells that do not invade cannot pass through the ECM, but migration can occur without ECM.

Figure 28: Top left panel: Cell invasion curve of three cells crossing Matrigel (8 mg/ml). Upper right panel: Cell migration curves of three cells on Matrigel (100 μl/ml). The abscissa is the time after the scratch (h), and the ordinate is RWD (%). Please note: MCF-7 cells only migrate and do not invade.
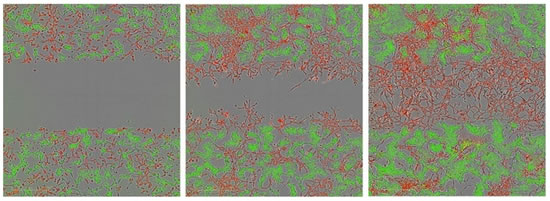
Figure 29: Invasive images of co-cultured cells in Matrigel. The cells were: CytoLight Red-labeled HT-1080 cells and CytoLight Green-labeled MCF-7 cells, respectively. It can be seen that HT-1080 cells invade, while MCF-7 cells do not invade (no entry into the scratched area).
(11) Chemotaxis Cell Migration
Chemotaxis is the direct movement of cells under the action of chemical stimuli (chemokines) and is a major component of the processes of immune response, tumor metastasis, wound healing and angiogenesis. Cell-based chemotaxis is critical to further study of these biological processes.
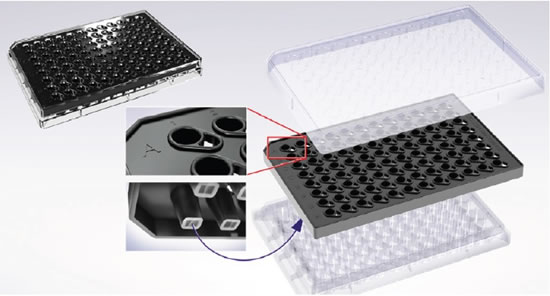
Figure 30: ClearView 96-well cell migration microplate for chemotaxis. The plate consists of three parts: the upper layer is the lid, the middle layer is the plate for planting cells, and the lower layer is the reagent tank. On the middle plate, there is an optically transparent film in each hole, and a plurality of precise holes with a diameter of 8 μm are printed by laser. During the experiment, cells were seeded into the membrane in the wells of the middle plate, and Chemoattractant was injected into the reagent tank of the lower plate. Then, the incubator was placed in an incubator to observe the movement of the cells through the pores under the action of chemokines.
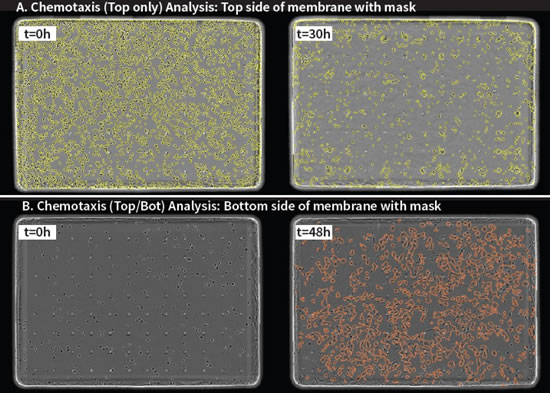
Figure 31: Top two images: Top-only analysis of T cells above the film, yellow is the pseudo-color of the phase difference image. Upper left panel: cells above the membrane at time t=0; upper right panel: when t=30h, it was affected by chemokine 200nM SDF-1α, and the cells above the membrane were greatly reduced. The next two images: HT-1080 cells under the film (Top/Bot analysis), orange is the pseudo-color mask of the phase difference image. Bottom left: The image below the membrane at t=0, there is no cell at this time; the lower right panel: at t=48h, it is affected by the chemokine 10% FBS, and a large number of cells are transferred to the lower part of the membrane.
The shortcomings and shortcomings of existing cell chemotaxis: 1) can not visualize the real-time movement of cells (such as: Boyden chamber Transwells); 2) low flux, experimental methods are technically demanding (eg microfluidic devices); 3) Lack of integrated quantitative analysis.
Advantages of the IncuCyte Chemotaxis solution: 1) Visualize real-time dynamic cell migration processes and perform fully automated analysis; 2) Highly repeatable 96-well dynamic experiments for screening; 3) Low cell dosage for rare Cells, expensive cells, or primary cell populations. The ClearView plate requires 2,000-20,000 cells per well per well, while the Transwell method requires a minimum of 150,000 cells per well per well; 4) is a surface-mediated migration process that provides detailed information on the phenotype; 5) The concentration gradient of chemokines on both sides of the membrane can be maintained for a longer period of time. The ClearView method maintains the concentration gradient for more than 72 h, while the Conwell method can observe a significant concentration gradient drop after 4 h.
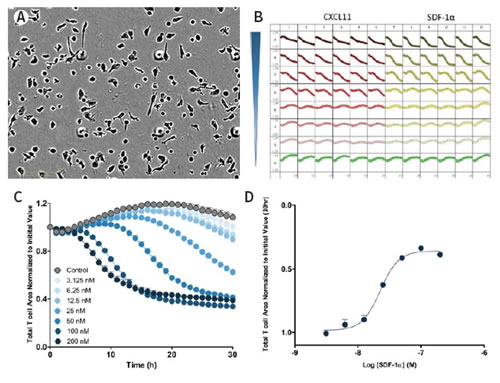
Figure 32: Image and data analysis of real-time 96-well chemotaxis. Top left: High-resolution phase contrast image of T cells on the IncuCyte ClearView 96-well plate. Upper right panel: 96-well plate curve of T cells for different concentrations of chemokines CXCL11 and SDF-1α. Bottom left panel: Dose response curve of T cells to different concentrations of chemokine SDF-1α, the ordinate is the cell area of ​​the plate. The greater the visible concentration, the faster the curve drops, indicating that the upper cells pass through the pores quickly. Bottom right panel: The dose response curve is plotted at 30 h data point, and the logarithm of the upper T cell area versus SDF-1α concentration is obtained.
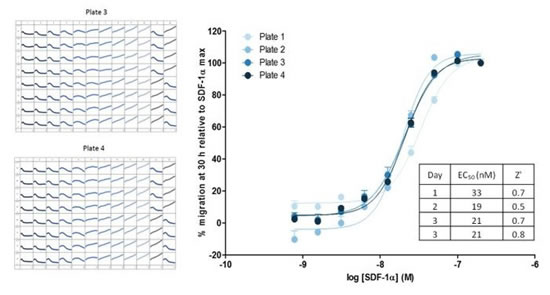
Figure 33: The chemotaxis of the 96-well curve shows excellent inter-plate repeatability. The Z's value of the four microplates was 0.5-0.7 in three days, and the corresponding concentration response curve to the chemokine SDF-1α showed reproducibility of response to SDF-1α (EC50 of 19-33 nM).
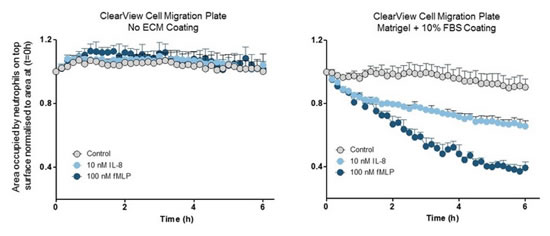
Figure 34: Detection of "surface contact" mediated cell migration. ClearView has a very low pore density, and cells must migrate on the membrane surface in order to move toward the chemokine. Left: The ClearView membrane was not coated and the cells did not migrate. The chemokines were IL-8 and fMLP. Right: The surface of the membrane is coated with Matrigel and the cells have significant chemotactic movement. This data shows that the interaction of integrin and/or cell surface receptors with the matrix is ​​key to the neutrophil chemotaxis in this model. In contrast, when neutrophil chemotaxis was performed in Transwell, no coating was required (data not shown).
(12) Monitoring angiogenesis (Angiogenesis)
Angiogenesis is a complex, multi-step process involving endothelial cell proliferation, endothelial cell migration, and angiogenesis. There are two types of frozen 96-well human co-culture angiogenesis kits to choose from: 1) CellPlayer Angiogenesis PrimeKit: GFP-tagged human vascular endothelial cells (HUVECs) and normal human dermal fibroblasts (normal human) In dermal fibroblast (NHDFs) co-culture, HUVEC cells have an angiogenic structure and are then observed with IncuCyte. IncuCyte ZOOM, in combination with CellPlayer Angiogenesis PrimeKit, monitors the entire process of angiogenesis and measures the effects of drugs on angiogenesis. 2) CellPlayer Angiogenesis StemKit: GFP-labeled endothelial colony-forming cells (EDFC) and adipocyte derived stromal cells (ADSC) are co-cultured, and EDFC has an angiogenic structure, then Observe with IncuCyte. IncuCyte ZOOM, in conjunction with CellPlayer Angiogenesis StemKit, monitors the entire process of angiogenesis and measures the effects of drugs on angiogenesis.
Key features include: 1) ZOOM and angiogenesis software can be combined to automatically obtain time-series images showing changes in all phases of angiogenesis; 2) observation time can be up to 2 weeks, and GFP-labeled endothelial cells are quantified by fluorescence; 3) Provide dynamic indicators such as vessel length, vascular area and number of branch nodes to calculate EC50/IC50 values; 4) Z'>0.6, good repeatability between plates, and 6 96-well plates at the same time, 576 data 5) Ability to measure pro-angiogenic and anti-angiogenic effects; 6) Dynamic readings to study complex pathways including VEGF (vascular endothelial growth factor) and non-VEGF (non-vascular)å†…çš®ç”Ÿé•¿å› å)信å·ä»‹å¯¼çš„血管新生和血管分解;7)所有数æ®å‡æœ‰å›¾åƒå’Œå½±ç‰‡è¿›è¡ŒéªŒè¯ï¼›8)PrimeKitå¯å±•ç¤ºè¡€ç®¡æ–°ç”Ÿçš„关键过程:增殖ã€è¿ç§»ã€åˆ†åŒ–å’Œå»åˆï¼›StemKit也能展示类似过程(pericyte like biology)。
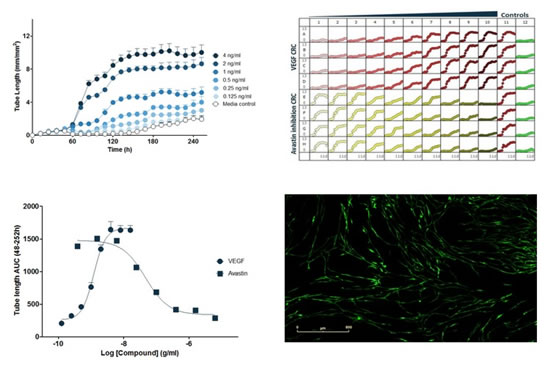
图35:在PrimeKit HUVEC和人皮肤æˆçº¤ç»´ç»†èƒžå…±åŸ¹å…»æ¨¡åž‹ä¸ï¼Œç”±è¡€ç®¡å†…çš®ç”Ÿé•¿å› å(VEGF)诱导的基于浓度的血管形æˆã€‚上左图:VEGF诱导的血管形æˆçš„æ—¶åºå›¾ã€‚上å³å›¾ï¼š96å”æ¿å›¾ï¼ŒVEGF在60håŠ å…¥ï¼Œæ¨ªåæ ‡ä¸ºæ—¶é—´ï¼ˆh),纵åæ ‡ä¸ºè¡€ç®¡é•¿åº¦ï¼ˆmm/mm 2 )。下左图:对时åºæ•°æ®çš„曲线下é¢ç§¯ï¼ˆAUC)进行分æžï¼Œå¾—到VEGF的浓度å“应曲线(峰值血管长度);和阿ä¼æ–¯æ±€ï¼ˆAvastin)对VEGF诱导(4ng/ml)血管形æˆçš„抑制的浓度å“应曲线(峰值血管长度)。下å³å›¾ï¼šVEGF(4ng/ml)诱导的血管结构图åƒã€‚
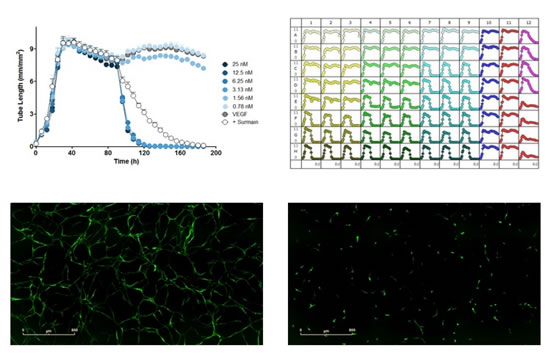
图36:在StemKit内皮克隆形æˆç»†èƒžå’Œè„‚肪æ¥æºåŸºè´¨ç»†èƒžçš„模型ä¸ï¼Œå¯¹å·²å½¢æˆçš„VEGF诱导的血管进行基于浓度的分解。上左图:考布他汀(combretastatin)(96håŠ å…¥ï¼‰å’Œè‹æ‹‰æ˜Žï¼ˆsuramin)(100µM,96håŠ å…¥ï¼‰å¯¹å·²å½¢æˆçš„ç”±VEGF(20ng/ml)诱导的血管的分解作用的时åºå›¾ã€‚上å³å›¾ï¼š96å”æ¿å›¾ï¼ŒVEGF分别于0h,96håŠ å…¥ï¼Œæµ‹è¯•è¯•å‰‚äºŽ96håŠ å…¥ã€‚æ¨ªåæ ‡ä¸ºæ—¶é—´ï¼ˆh),纵åæ ‡ä¸ºè¡€ç®¡é•¿åº¦ï¼ˆmm/mm2)。下左图:VEGF(20ng/ml)诱导的血管形æˆå›¾åƒã€‚下å³å›¾ï¼šåŠ 入微管分解试剂考布他汀(3nM)åŽçš„图åƒã€‚
(å三)神ç»ç”Ÿé•¿è·Ÿè¸ªï¼ˆKinetic NeuroTrack)
IncuCyte ZOOMå’ŒNeuroTrack套件åˆç”¨ï¼Œå¯å®šé‡åˆ†æžåŽŸä»£ç¥žç»ç»†èƒžå’Œå¤šèƒ½è¯±å¯¼å¹²ç»†èƒžæ¥æºï¼ˆiPSC-derived)的神ç»ç»†èƒžçš„神ç»çªçš„生长状况,得到图åƒå’Œç”Ÿé•¿æ›²çº¿ã€‚
关键特性包括:1)å¯å¯¹ç¥žç»ç»†èƒžçš„动æ€ç”Ÿé•¿ï¼ˆå¦‚神ç»çªé•¿åº¦ã€åˆ†æ”¯èŠ‚点ã€ç»†èƒžç°‡ï¼‰è¿›è¡Œéžæ ‡è®°çš„实时动æ€çš„定é‡åˆ†æžï¼Œå¯æ¶ˆé™¤è€—费人力的昂贵的对神ç»ç»†èƒžçš„å…疫染色过程;2)自动的图åƒèŽ·å–和整åˆçš„分æžè½¯ä»¶æ–¹ä¾¿è¿›è¡Œå‡†ç¡®çš„神ç»çªæ£€æµ‹å’Œæ•°æ®åˆ†æžï¼›3),å¯åŒæ—¶å¾—到高清晰相差图åƒå’Œå¤šé€šé“è§å…‰å›¾åƒï¼›4)用活细胞è§å…‰æ ‡è®°ç ”究神ç»å…ƒç»†èƒžå’Œæ”¯æŒç»†èƒžï¼ˆå¦‚星形胶质细胞astrocytes)共培养时神ç»çªé•¿åº¦å’Œåˆ†æ”¯èŠ‚点个数;5)NeuroLight Red神ç»æ ‡è®°è¯•å‰‚å¯åœ¨ç¥žç»å…ƒç»†èƒžä¸ç”Ÿæˆéžæ‰°åŠ¨çš„红色è§å…‰è›‹ç™½ï¼ˆmKate2)信å·ã€‚6)与多ç§ç¥žç»ç»†èƒžç±»åž‹ç›¸å…¼å®¹ï¼ˆåŒ…括细胞系ã€åŽŸä»£ç»†èƒžå’Œå¹²ç»†èƒžæ¥æºçš„细胞);7)å¯è¿›è¡Œå¤šé‡å®žéªŒï¼Œå¦‚和神ç»ç»†èƒžæ¯’性ã€ç¥žç»ç»†èƒžå‡‹äº¡ã€ç¥žç»ç»†èƒžå¢žæ®–和神ç»ç»†èƒžè¿ç§»ç‰å®žéªŒä¸€èµ·è¿›è¡Œã€‚

图37:NeuroTrack软件分æžé«˜æ¸…晰度相差图åƒã€‚æŒ‡æ ‡åŒ…æ‹¬ï¼šæ€»ç¥žç»çªé•¿åº¦ï¼ˆå·¦å›¾ï¼‰ã€ç¥žç»ç»†èƒžç°‡æ•°ç›®ï¼ˆä¸å›¾ï¼‰å’Œåˆ†æ”¯èŠ‚点个数(å³å›¾ï¼‰
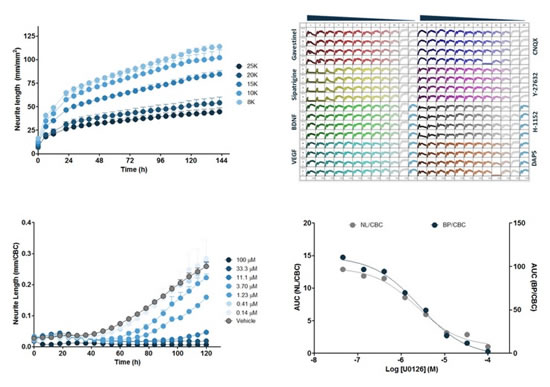
图38:上左图:iPSCæ¥æºçš„iCell神ç»ç»†èƒžåœ¨ä¸åŒæŽ¥ç§å¯†åº¦ä¸‹çš„96å”æ—¶åºå›¾ã€‚横åæ ‡ä¸ºæ—¶é—´ï¼ˆh),纵åæ ‡ä¸ºç¥žç»çªé•¿åº¦ï¼ˆmm/mm 2 ),æ¯ä¸ªæ•°æ®ç‚¹ä¸º6个å”çš„å¹³å‡å€¼ã€‚上å³å›¾ï¼š384å”æ¿å›¾ï¼ŒiCell神ç»ç»†èƒžçš„神ç»çªé•¿åº¦ï¼ˆmm/mm 2 )在8ç§ä¸åŒåŒ–åˆç‰©ï¼ˆ48håŠ å…¥ï¼‰ä½œç”¨ä¸‹çš„æ—¶åºå›¾ï¼Œç»†èƒžåœ¨72h用IC80浓度的Kainic acid处ç†ã€‚下左图:Neuro-2A细胞用MEK抑制剂U0126处ç†çš„æ—¶åºå›¾ã€‚下å³å›¾ï¼šU0126对“神ç»çªé•¿åº¦/细胞簇â€å’Œâ€œåˆ†æ”¯èŠ‚点个数/细胞簇â€çš„浓度å“应曲线。

图39:NeuroTrack软件分æžç”¨NeuroLight Red慢病毒试剂转染的红色è§å…‰å›¾åƒã€‚左图:红色è§å…‰å›¾åƒï¼›ä¸å›¾ï¼šç¥žç»çªçš„åˆ†å‰²æ ‡è®°ï¼ˆé»„è‰²ï¼‰å’Œè§å…‰å›¾åƒçš„å åŠ ï¼Œç™½è‰²åœ†ç‚¹ä¸ºåˆ†æ”¯èŠ‚ç‚¹ï¼›å³å›¾ï¼šç»†èƒžç°‡çš„åˆ†å‰²æ ‡è®°ï¼ˆè“色)和è§å…‰å›¾åƒçš„å åŠ ã€‚
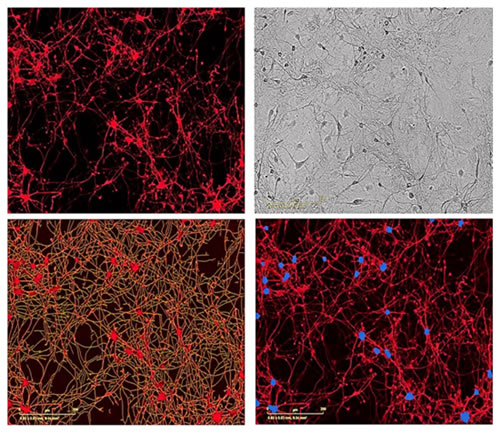
图40:用NeuroPrime Cell Kitå’ŒNeuroTrack软件套件测é‡åŽŸä»£é¼ å‰è„‘神ç»ç»†èƒžå’Œé¼ 星形胶质细胞共培养时的神ç»çªçš„ç”Ÿé•¿ã€‚ä¸Šå·¦å›¾ï¼šå…±åŸ¹å…»çš„åŽŸä»£é¼ å‰è„‘神ç»ç»†èƒžç”¨NeuroLight慢病毒试剂转 染,接ç§7天åŽæˆåƒï¼ˆ20å€ç‰©é•œï¼‰ã€‚上å³å›¾ï¼šå¯¹åº”的高清晰度相差图åƒã€‚下左图:软件自动对神ç»çªè¿›è¡Œå›¾åƒåˆ†å‰²æ ‡è®°ï¼ˆé»„色)。下å³å›¾ï¼šè½¯ä»¶è‡ªåŠ¨å¯¹ç»†èƒžç°‡è¿›è¡Œåˆ†å‰²æ ‡è®°ï¼ˆè“色)。
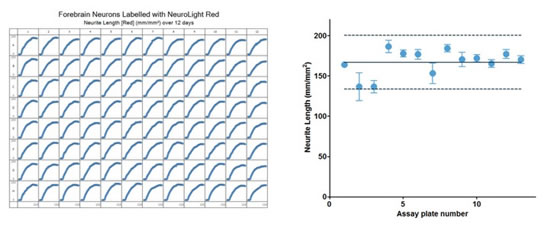
图41:用NeuroTrack分æžå’Œé¼ æ˜Ÿå½¢èƒ¶è´¨ç»†èƒžå…±åŸ¹å…»çš„åŽŸä»£é¼ å‰è„‘神ç»ç»†èƒžçš„神ç»çªé•¿åº¦ï¼Œç¥žç»ç»†èƒžç”¨NeuroLight Redæ ‡è®°ï¼Œæ—¶é—´ä¸º12天。左图:对神ç»çªé•¿åº¦çš„96å”æ¿å›¾ã€‚å³å›¾ï¼šå®žéªŒçš„稳定性。图上的è“色圆点表示13个微å”æ¿çš„å¹³å‡åˆ—的神ç»çªé•¿åº¦ï¼ˆæ—¶é—´ä¸º288h)。实线表示平å‡ç¥žç»çªé•¿åº¦ï¼Œè™šçº¿è¡¨ç¤ºå¹³å‡å€¼çš„±20%。
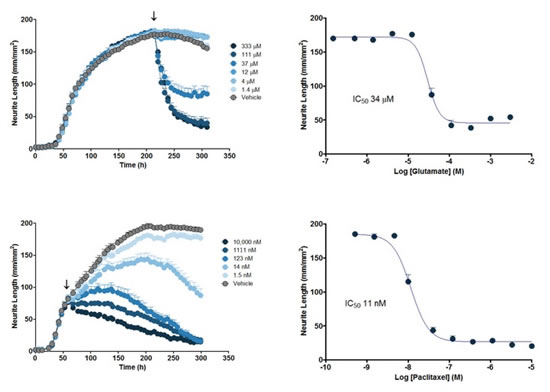
图42:用NeuroPrime Cell Kitå’ŒNeuroTrack软件套件测é‡ç¥žç»çªç”Ÿé•¿çš„定é‡è¯ç†å¦ç ”究。上左图:在DIV9åŠ å…¥è°·æ°¨é…¸ç›ï¼ˆglutamate)åŽç¥žç»çªé•¿åº¦çš„浓度ä¾èµ–性å‡å°ã€‚上å³å›¾ï¼šä»Ž287hçš„æ•°æ®å¾—到的,神ç»çªé•¿åº¦å¯¹è°·æ°¨é…¸ç›çš„浓度å“应曲线和IC50值。下左图:在DIV3åŠ å…¥ç´«æ‰é†‡ï¼ˆpaclitaxel)åŽç¥žç»çªé•¿åº¦çš„浓度ä¾èµ–性å˜åŒ–。下å³å›¾ï¼šä»Ž263hçš„æ•°æ®å¾—到的,神ç»çªé•¿åº¦å¯¹ç´«æ‰é†‡çš„浓度å“应曲线和IC50值。
总结:
以上一些关键的é‡è¦çš„应用介ç»ï¼Œå±•ç¤ºäº†IncuCyteZOOM 系统在定é‡çš„ã€éžå…¥ä¾µæ€§çš„ã€å®žæ—¶ç»†èƒžåˆ†æžä¸Šçš„作用。éžæ ‡è®°ã€éžæŸä¼¤æ€§çš„æˆåƒæŠ€æœ¯ä»¥åŠæ•°æ®åˆ†æžå¯ä»¥è®©ç”¨æˆ·èŽ·å¾—高质é‡çš„图åƒã€å½•åƒå’Œæ•°æ®ã€‚与其他利用电å阻抗监测细胞ä¸åŒï¼ŒIncuCyteå¯ä»¥è®°å½•ç»†èƒžå½¢æ€ï¼Œå¾—到图åƒå’ŒåŠ¨æ€çš„录åƒã€‚å¦å¤–,Essen还开å‘出更多的活细胞实时动æ€è§‚察试剂盒(live cell kinetic assays and reagents),与ZOOMé…套使用,进行实验开å‘(assay development)ã€æŠ€æœ¯è¯„估(technology assessment)ã€å¤–包æœåŠ¡ï¼ˆfee-for-service outsourcing)和è¯ç‰©å¼€å‘åˆä½œï¼ˆdrug discovery partnerships)。
订è´ä¿¡æ¯ï¼šIncuCyte ZOOM分HDå’ŒHD/2CLR两款,HDåªèƒ½åšç›¸å·®æˆåƒï¼Œè€ŒHD/2CLRå¯ä»¥åšç›¸å·®å’Œçº¢/绿åŒè‰²è§å…‰æˆåƒï¼Œå¹¶ä¸”HDå¯ä»¥å‡çº§åˆ°HD/2CLR。套件包括:细胞è¿ç§»/ä¾µè¢å¥—件(包括分æžè½¯ä»¶ã€96å”划痕器Wound Makerå’Œ15å—96å”ImageLockå¾®å”æ¿ï¼‰ã€ç¥žç»è·Ÿè¸ªå¥—件(包括分æžè½¯ä»¶ï¼‰ã€è¡€ç®¡æ–°ç”Ÿå¥—件(包括分æžè½¯ä»¶ï¼‰å’Œè¶‹åŒ–è¿åŠ¨å¥—件(包括分æžè½¯ä»¶ï¼‰ã€‚
更多信æ¯ï¼Œè¯·å‚考Essen网站:和典奥生物网站:
大ä¸åŽåŒºæ€»ä»£ç†ï¼šä¸Šæµ·å…¸å¥¥ç”Ÿç‰©ç§‘技有é™å…¬å¸ã€‚è”系方å¼ï¼ˆå¸‚场部刘ç»ç†ï¼‰ï¼šç”µè¯ï¼šï¼ˆ+86)21-58605185ï¼Œä¼ çœŸï¼šï¼ˆ+86)21-51973282,邮箱:和。请关注微信公众å·â€œå…¸å¥¥ç”Ÿç‰©ç§‘技â€ï¼štekontech,获å–更多信æ¯ï¼
Sweet Gummies,OEM Gummy Candy,Gummy Food Candy,Popular Gummy Candy
Montreal Shantou Food Co., Ltd , https://www.montrealsnack.com