Introduction to the use of CASP comet analysis software free version
2022-09-16 13:07:01
The introduction of the CASP comet analysis software free version mainly includes two parts, 1, the CASP software is free to download and install; 2. The CASP software uses detailed illustration.
CASP software is free to download and install :
The work interface is registered on the website "Download". Download the CASP comet analysis software (free version) compression package. After decompressing, you can see the CASP comet analysis software (free version) application. be usable.
The CASP software uses detailed illustrations :
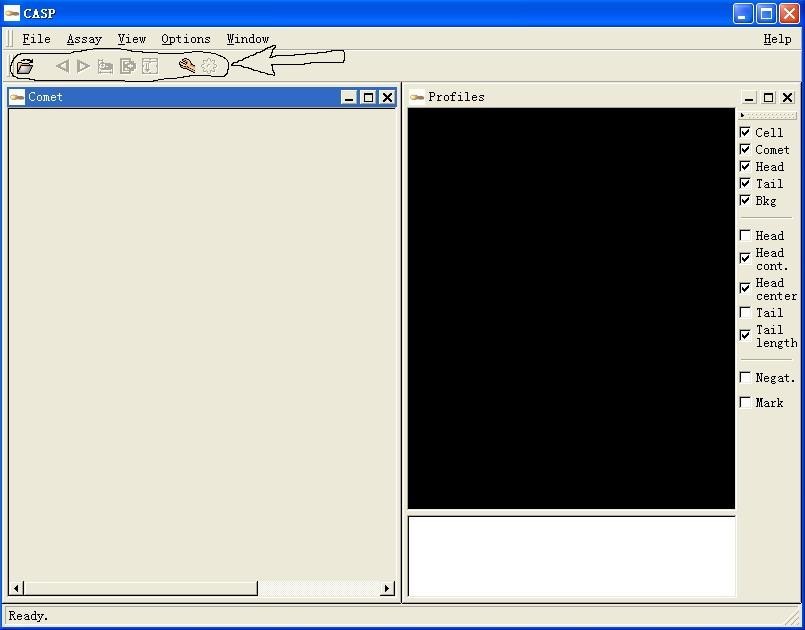
First, this is the working interface of the software, pay attention to the several buttons pointed by the arrow, mainly work with these buttons.
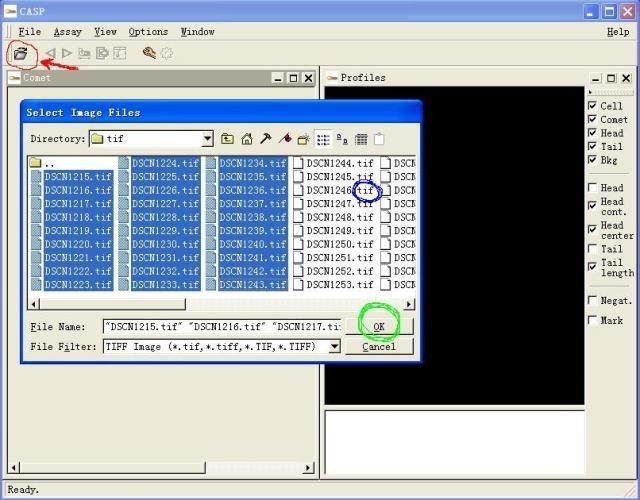
2. Click the button indicated by the red arrow to open the file. Note that the image file should be in TIF format (blue circled). Hold down the SHIFT button to select multiple files at the same time, click OK, (green circle) The CASP software reads in the image file of your choice.
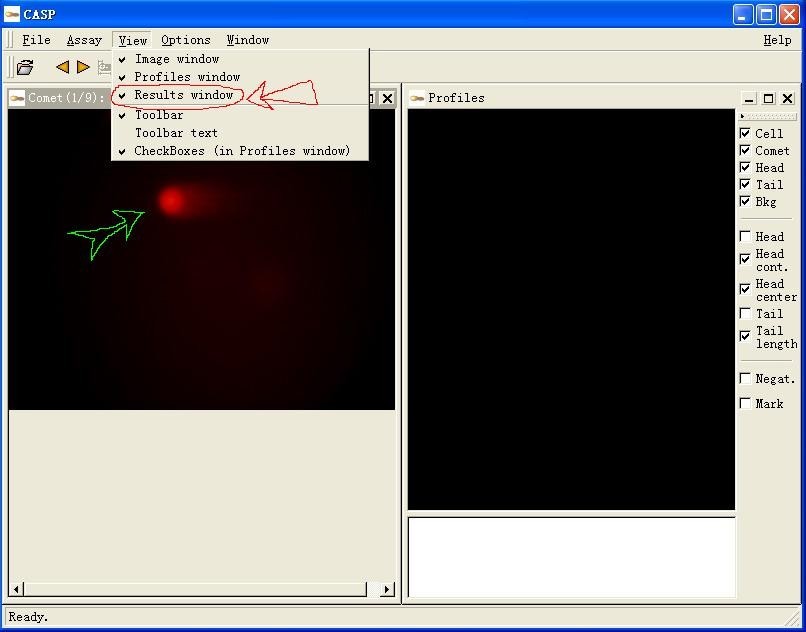
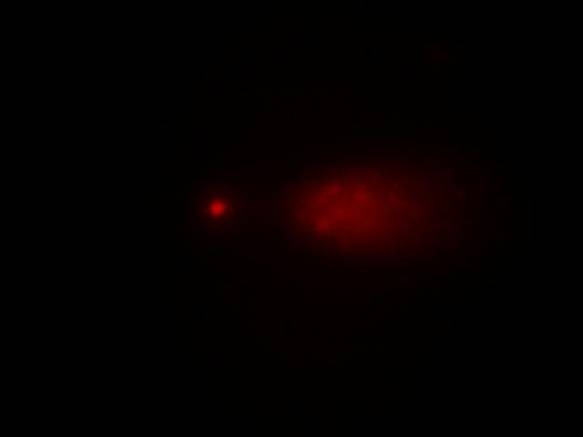
Third, click the view drop-down menu, select the "result window" pointed by the red arrow, after analysis you can see your result window, the green arrow refers to the comet image I made.
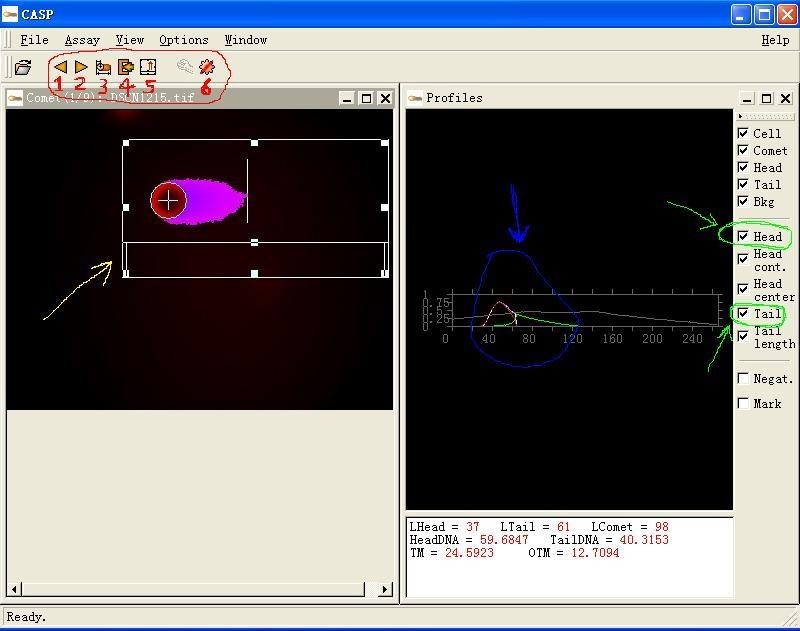
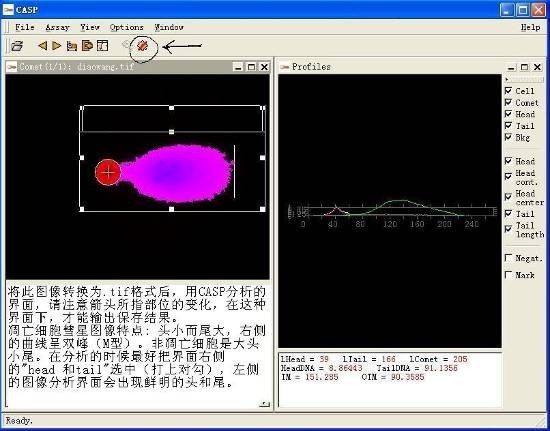
Fourth, you can start the analysis below. Before the analysis, it is best to select the head and tail on the right side (the green arrow points, so that the visual effect of the head and tail can be clearly displayed, as shown in the figure), and press and hold in the image analysis box. The left button is pulled down, and the box indicated by the yellow arrow appears. This box must enclose the entire comet image to be analyzed, and then the button for the red circled area is used. I have separately labeled them and explained them one by one: 1 and 2: You can select the image before or after the analysis, that is, the previous and next functions, analyze the first one, of course, choose the next analysis, very simple! ! !
3: This is the function key of the analysis. After the frame pointed by the yellow arrow is enclosed in the comet, click this button to analyze it.
4: After each analysis of a comet, click on it, it will save the result data to the results window, and it will be grayed out after clicking. (This is very important).
5: Background selection button, click on it, the background of the box will change up and down, (note the box pointed by the yellow arrow, the smaller box is the background box, the larger is the work box, these two boxes can be adjusted before analysis The general work box is larger than the background box.
6: You must click on it before the formal analysis, otherwise there will be no result. If you don't click it, just pre-analyze the state. In this state, you can adjust the analysis condition and then enter the formal analysis. After clicking it, the button will be A slash appears. (Figure).
The area indicated by the blue arrow is the analyzed curve, the main curve is a single peak, and if it is a double peak, it is an apoptotic cell. Several data are listed below the graph, not complete, and all results are in the results window. (The following figure)
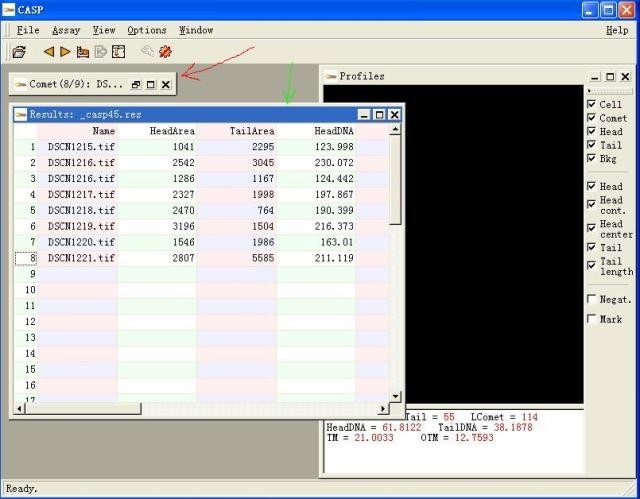
5. During the analysis or after the analysis is completed, you can view your result window. As shown in the figure, minimize the image analysis window (red arrow), and display the result window (green arrow). The file name is from left to right. (name) and various indicators of the analysis.
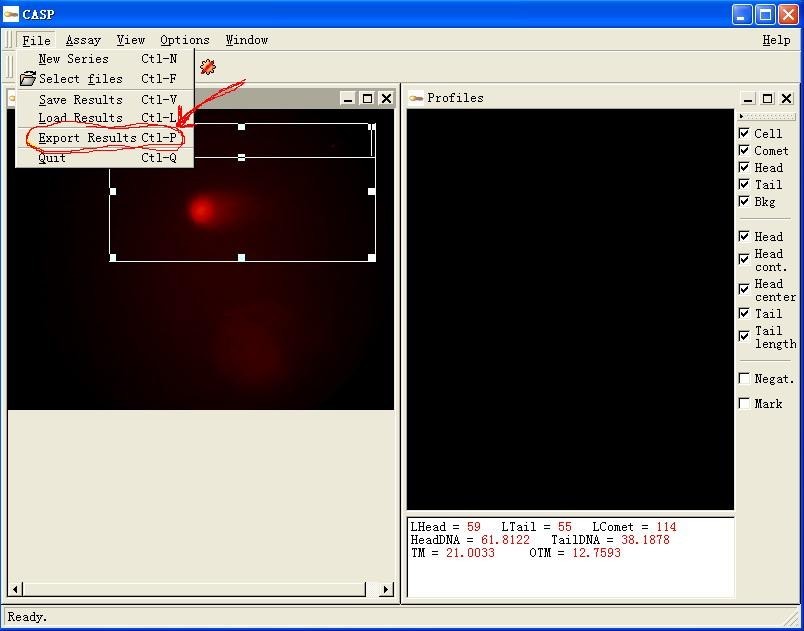
6. After the analysis is completed, don't forget to output the result. Click the file drop-down menu and select the “output result†of the area indicated by the red arrow. The image of the seventh step will appear.
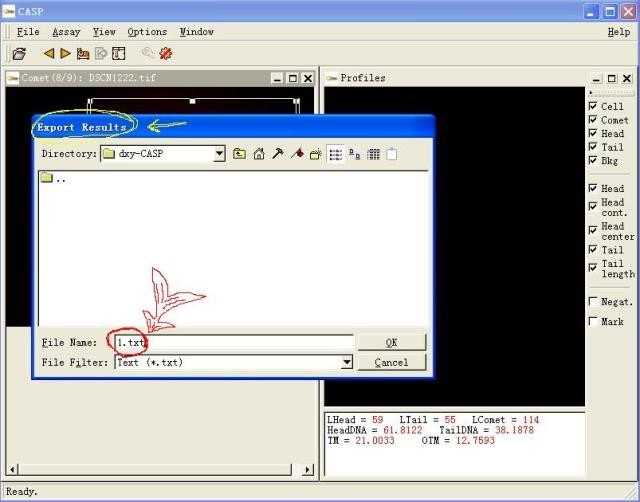
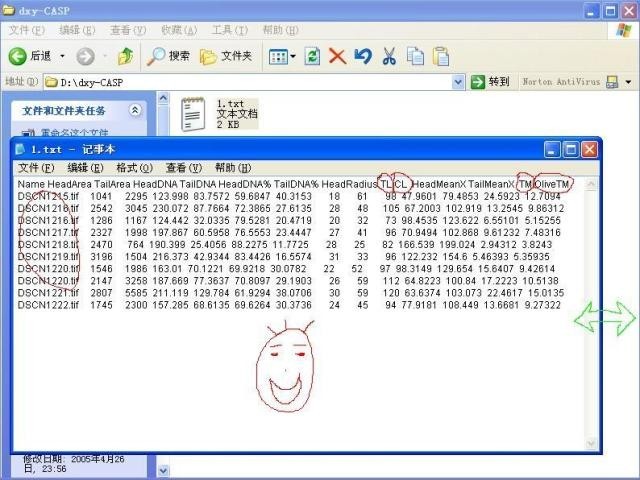
Seven, after selecting the output result, the following result output window appears, (yellow area), first create a folder to save your result file, that is, give your results a nest, huh, huh, good, give you Take a name for the file, don't forget that its extension is .txt, click OK!
Eight, find the result file you saved, I just saved 1.txt, open it and see, the result seems a bit messy, what should I do? And look at the next decomposition.
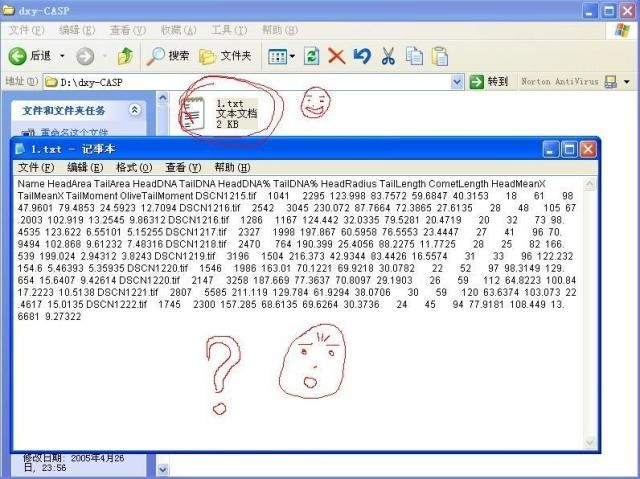
Nine, it doesn't matter, just adjust the results a little, just look at it. (To transfer the results directly into the SPSS statistical software analysis, you must make adjustments!!!). Adjust the width of the text box (at the green arrow) and put the analyzed indicators on the first line, but the English words of each indicator are longer and simplify, such as: taillength becomes tl, cometlength becomes cl, red circle is fixed, I will not repeat them one by one. After the adjustment, the left side is the name of the image, and the right is the data of each indicator, pay attention! ! ! There must be spaces between each indicator name and data! ! ! Otherwise you can't transfer to SPSS statistics software!
X. The latter work is how to use SPSS statistical analysis. DXY seems to have a special section introduction, I will not say it, if there is any doubt, explain it.
XI, with apoptotic cell analysis image.jpg
Plant extracts refer to substances extracted or processed from plants (all or a part of plants) using appropriate solvents or methods, and can be used in the pharmaceutical industry, food industry, daily chemical industry and other industries.

There is a conceptual overlap between plant extracts and herbal extracts. The raw materials of plant extracts in my country are mainly derived from Chinese herbal medicines, so domestic plant extracts can also be called Chinese medicine extracts to some extent.

Herbal Extract,Liquid Herbal Extracts,Herbal Extract Powder,Natural Herbal Extract
XI AN RHINE BIOLOGICAL TECHNOLOGY CO.,LTD , https://www.rhinebiotech.com