Using ultra-efficient convergent chromatography (UPC)
Erin Chambers and Kenneth J. Fountain
Waters Corporation (Milford, MA, USA)
Application advantage
Waters Solutions
Key words
Convergence chromatography, Oasis, sample preparation, bioanalysis, tricyclic antidepressants, quantification, UPC 2
Introduction
Tricyclic antidepressants (TCA) are an older class of drugs but still have pharmacological effects. For example, drug subjects who are less responsive to other antidepressants are still more common, thus determining that TCA still has a continuous living space. In addition, these drugs are much cheaper than other newer antidepressants and are therefore used in clinics. In the past, TCA was analyzed using GC, UV, or LC/MS. The UPC 2 TM technology allows analysis of organic extracts and is therefore highly appreciated in the field of bioanalytical assays. Organic extracts can be obtained by the most common sample preparation methods in the field, such as protein precipitation (PPT), liquid-liquid extraction (LLE), and solid phase extraction (SPE). Reversed-phase chromatography systems require evaporation and reconstitution of organic extracts prior to injection, while non-aqueous solvent systems do not require this. UPC 2 technology has the main solvent (CO 2 ) environmental protection, renewable, orthogonal experiments with reversed-phase chromatography, and the ability to utilize a variety of stationary phases, which has the advantages of low solvent consumption and low cost. The selectivity and flexibility of bioanalytical method development. Therefore, this experiment takes the analysis of TCA in human urine as an example, and conducted an empirical study to confirm the applicability of UPC 2 separation. The structure of the specific TCA used in the study is shown in Figure 1. Although the GC and LC method development approaches are well defined and used in routine applications, the development of UPC 2 separation methods is still a relatively new area of ​​research. This application note highlights some of the key UPC 2 parameters and provides the applicable screening options. For example, column chemistry, pH, and injection solvent are systematically automated by the column manager and quaternary solvent switching system. After selecting the column, mobile phase, and injection solvent, the system optimizes the gradient and analyzes the urine extract using the optimal conditions obtained through the screening test. In urine testing, the lower limit of quantitation (LLOQ) of each antidepressant is easily achieved at 0.1 ng/mL, in line with the FDA's LLOQ assay for bioanalytical methods. In addition, the simplified standard curve (without internal standard) has good linearity and accuracy in the range of +/- 1% to 8%.
experiment
UPC 2 conditions
System: ACQUITY UPC 2
Column: ACQUITY UPC 2 BEH
2.1 × 50 mm, 1.7 μm
Mobile phase A: CO 2
Mobile phase B: methanol cleaning solvent with 0.2% NH4OH: 60:40 acetonitrile / isopropanol + 2% formic acid separation mode: mobile phase B increased from 2.0% to 40% in 2 min; maintained at 30% Min.
Flow rate: 1.4 mL/min
CCM back pressure: 1750 psi
Column temperature: 40 °C
Sample temperature: 10 °C
Injection volume: 2.0 μL
Running time: 3.0 min
Rehydration Flow Rate: 0.25 mL/min Isopropyl Alcohol Collection Plate with 0.2% NH4OH: Waters® 1 mL ACQUITY® Collection Plate
MS condition
Mass spectrometer: Xevo TQ-S
Ionization mode: ESI+
Capillary voltage: 1.0 kV
Collision energy: optimized by component (see Table 1)
Taper hole voltage: optimized by composition (see Table 1)
Data management
Chromatography software: MassLynx®
Quantitative software: TargetLynxTM
Optimization Software: IntelliStartTM
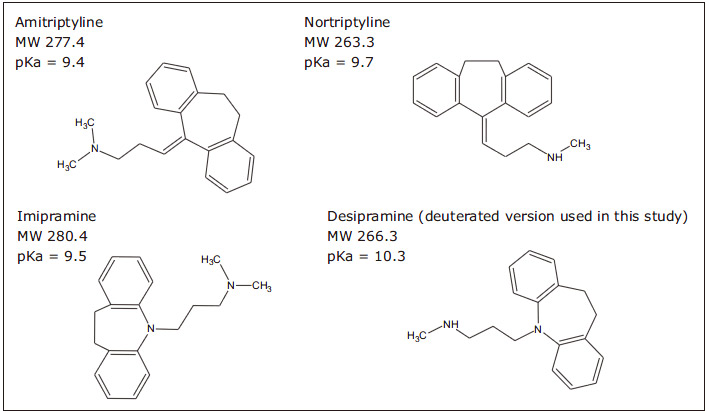
Figure 1. Structural formula of a tricyclic antidepressant analyte.
experiment
sample discription
Urine samples were prepared using an Oasis WCX 96-well μElution plate. First, add 200 μL of 4% H 3 PO 4 solution to a 200 μL sample and mix; first equilibrate each well in the extraction plate with 200 μL of methanol, then equilibrate with 200 μL of water; dilute the sample (400 μL) Loading onto the plate; rinsing with 200 μL of 10 mM ammonium acetate solution (pH 6), 200 μL of methanol; eluting TCA with 2% formic acid in ACN/MeOH (60:40) solution, 25 μL each time, wash Take off 2 times and combine the eluents. Take 2 μL of the eluent directly into the ACQUITY UPC 2 system.
Both the stock solution and the working solution were treated with methanol. A urine sample containing 5 antidepressants was prepared by adding 20 μL of a composite working solution (concentration of each compound at 1 μg/mL) to 2 mL of urine. The urine sample concentration was 10 ng/mL. Other concentrations of sample solutions were prepared by serial dilution of high concentrations of standard solutions using control human urine. In this demonstration, the final concentrations of urine samples prepared and used for extraction were: 0.1, 0.2, 0.5, 1.0, 5.0, and 10.0 ng/mL, respectively. To determine the lower limit of quantitation (LLOQ), the experiment also extracted blank urine.
Analyte | Mother ion m/z | Daughter ion m/z | Cone hole voltage (V) | Collision energy (eV) |
Amitriptyline | 278.3 | 233.1 | 30 | 18 |
Nortriptyline | 264.3 | 233.4 | 28 | 15 |
Imipramine | 281.3 | 85.8 | 25 | 20 |
Desipamine-D3 | 267.4 | 208.1 | twenty two | 25 |
Table 1. MS conditions for the four antidepressant groups.
Results and discussion
Mixed mode SPE has previously been shown to be the most commonly selected method of sample preparation in bioanalysis, depending on the bi-orthogonal retention mechanism of its isolated analyte and endogenous interferent. Therefore, the mixed mode SPE is the first choice for this experiment. The use of a mixed mode weak cation exchanger is based on two reasons: the analyte is basic and needs to be retained by ion exchange; the final eluate of this particular adsorbent is actually acidic. The screening results of the injection solvent showed that the best peak shape and sensitivity were obtained with the acidic injection solvent (not shown here). Therefore, Oasis WCX is the best choice. The general extraction method was slightly modified to ensure that all analytes were completely retained by ion exchange. After the human urine is treated with SPE, the recovery of all analytes in the final eluate is 92% to 104%, and the RSD is 3% to 6%. The SPE eluent can be injected directly without further dilution or evaporation, simplifying the entire workflow and increasing throughput.
Systematic chromatographic screening
The method development process systematically screens the column, modifier and modified additive to obtain the best separation result. The four UPC 2 columns screened were as follows: ACQUITY UPC 2 BEH, BEH 2-EP, HSS C 18 SB, and CSHTM Fluoro-Phenyl, all with a column size of 2.1 × 50 mm and a particle size of 1.7 μm. The three mobile phase B solvents were methanol, methanol containing 0.2% formic acid, and methanol containing 0.2% NH 4 OH. The screening process used mobile phase B to increase from 2% to 45% in 3 min and a common gradient of 1.5 min at 45%. When methanol with ammonium hydroxide was added as the mobile phase, the peak shape, sensitivity and resolution of each column were optimized. The comparison of the analysis results of the four stationary phases using this high pH mobile phase is shown in Figure 2. The order of the peaks of the other columns is similar except for the HSS SB column. However, the peaks derived from the HSS SB column are significantly wider, which results in a lower signal-to-noise ratio and affects the detection of low-concentration samples. Peak broadening may be due to secondary interactions between the analyte and the stationary phase. Analysis of other classes of compounds using the ACQUITY UPC 2 system (not covered in this section of the experiment) found that peak shape can be improved by using a buffered mobile phase modifier (eg, 20 to 40 mM ammonium formate). In the study of this paper, the main goal of chromatographic analysis is not to achieve absolute baseline separation of analytes, but to obtain the best peak shape and highest sensitivity, so we measured the peak area obtained from each column. The analyte peak areas obtained using each column under high pH modifier conditions are shown in Table 2.
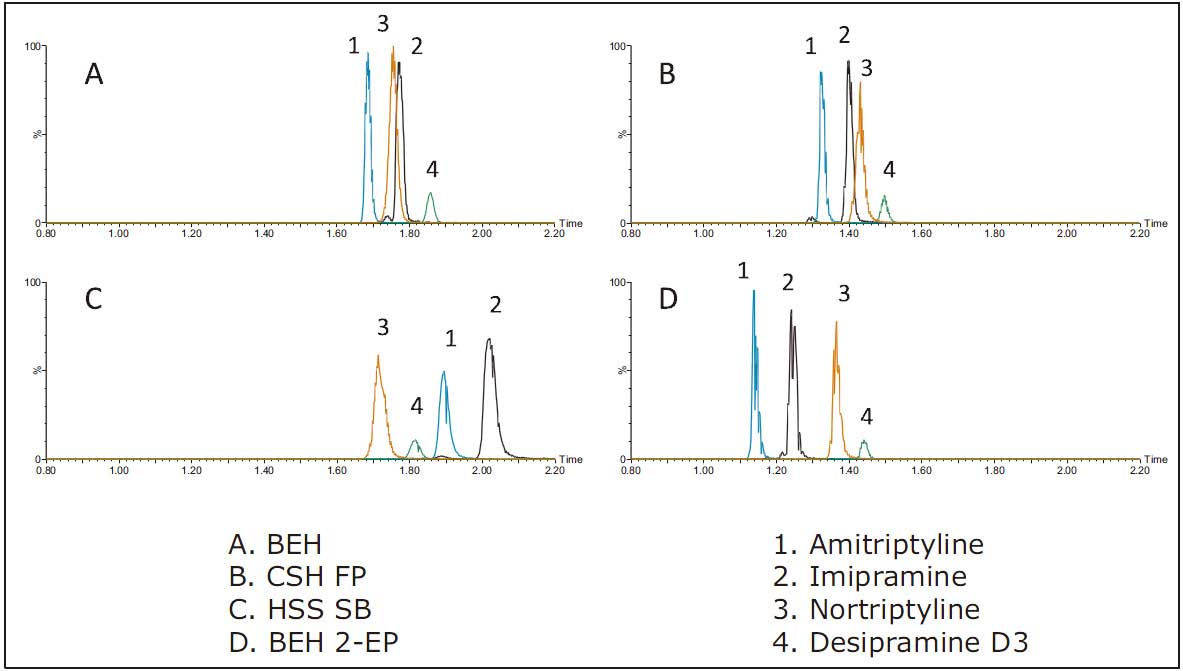
Figure 2: Analysis results of different stationary phases when methanol containing 0.2% NH 4 OH was used as mobile phase B.
BEH column | BEH 2-EP column | HSS C 18 SB column | CSH FP column | |
Amitriptyline | 1066581 | 940444 | 968946 | 940657 |
Imipramine | 1291389 | 1180698 | 1690693 | 1145127 |
Nortriptyline | 1586550 | 963422 | 1256074 | 1143857 |
Desipamine | 245922 | 149734 | 219268 | 208580 |
Table 2. Summary of peak areas obtained using 4 different columns.
In the screening experiments of different columns, there was no significant change in the peak area of ​​amitriptyline and imipramine, but the peak area was significantly changed by the chemical properties of desipramine and nortriptyline. For example, desipramine has a peak area increased by 11% to 40% compared to other columns when analyzed on a BEH column. Similarly, the peak area of ​​nortriptyline increased by 21% to 40% compared to other columns under BEH column analysis conditions. Although the overall separation of the BEH 2-EP column is slightly better than other columns, the signal strength is higher with the BEH column. Therefore, BEH columns are the best choice for quantitative analysis of low concentration levels of TCA. In addition, the average baseline peak width of the peaks obtained from the BEH column is <2 s, which improves the signal-to-noise ratio measured for low-concentration samples.
When the test was performed on each column, the maximum system pressure was observed to be less than 4200 psi. The system operated well below the pressure limit, and the flow rate can be flexibly increased as needed to further reduce the running time.
In addition to screening the stationary phase, different modifiers were evaluated in this experiment. Figure 3 shows the effect of different mobile phase B modifiers on the ACQUITY UPC 2 BEH column. The trend for other columns is similar. The best resolution and peak shape are often obtained with NH 4 OH as a modifier. When methanol was used alone as the mobile phase, the peak obtained was the widest, the elution time was the latest, and the resolution was the worst. When formic acid is selected as the modifier, the analysis results obtained are longer than the retention results obtained using NH 4 OH, the resolution is lowered and the peak is wider.
In order to reduce run time and increase sample throughput, this experiment "compressed" the screening gradient. The results showed that the peak shape, resolution and sensitivity obtained after gradient compression were not negatively affected. The final total run time was determined to be 3 min.
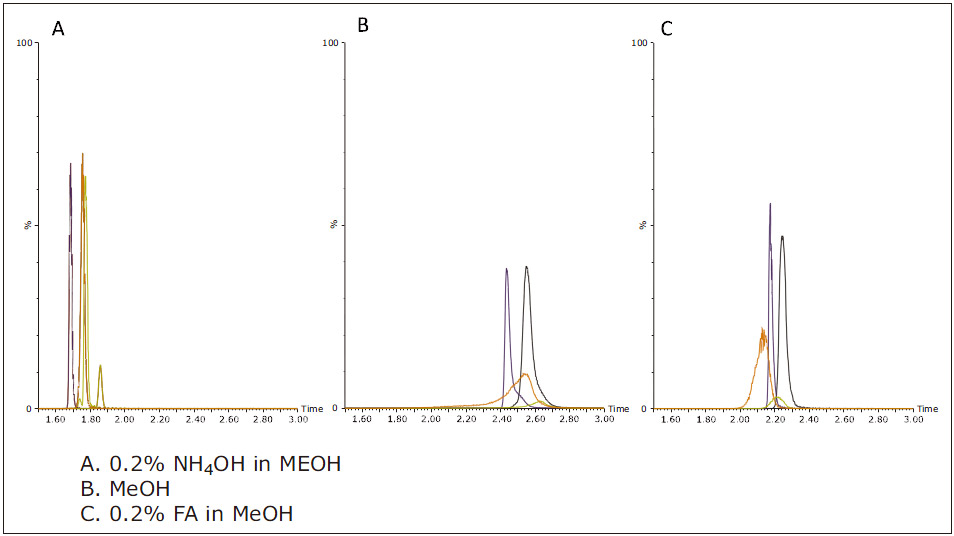
Figure 3: Analysis results obtained by adding different modifiers to mobile phase B when using BEH columns.
Sensitivity, linearity, and quantitative accuracy
The accuracy and linearity of the method were also evaluated by a small number of studies. A simplified standard curve (no internal standard) was prepared using control human urine at concentrations ranging from 0.1 to 10.0 ng/mL. The analysis was carried out using the analysis conditions finally determined in the "Experiment" section. The curve calculated by the weighting coefficient of 1/x was linear, R2>0.998, and the average deviation of the theoretical concentration of each standard curve point was <8%. Table 3 shows typical standard curve statistics for amitriptyline. 0.1 ng/mL LLOQ is easy to implement for all analytes. At this concentration, the signal to noise ratios of amitriptyline, imipramine, nortriptyline, and desipramine-D3 were 334:1, 292:1, 590:1, and 66:1, respectively. The signal intensity of each component is 5 times that of the blank urine sample extract and meets the FDA's LLOQ assay. Figure 4 shows a typical extracted ion chromatogram of 0.1 ng/mL desipramine-D3 and blank urine.
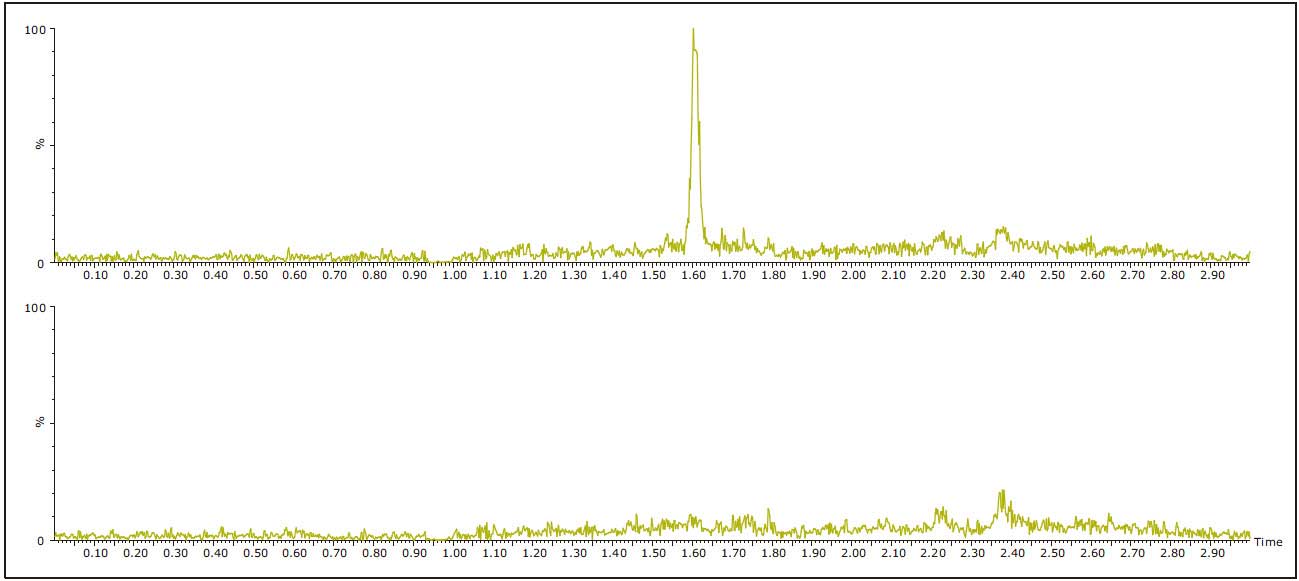
Figure 4. Blank urine extract (lower chromatogram) and urine extract containing 0.1 ng/mL desipramine-D3 (top chromatogram).
Standard solution concentration (ng/mL) | keep time | Peak area | % deviation from theoretical value | Accuracy% |
0.1 | 1.48 | 16161 | -3.3 | 96.7 |
0.2 | 1.48 | 27061 | 2.7 | 102.7 |
0.5 | 1.48 | 60531 | 7.9 | 107.9 |
1.0 | 1.48 | 103149 | -3.6 | 96.4 |
5.0 | 1.48 | 467997 | -7.9 | 92.1 |
10.0 | 1.48 | 999886 | -0.9 | 99.1 |
Table 3. Typical standard curve statistics for amitriptyline (extracted from human urine).
in conclusion
UPC 2 technology has been successfully applied to the analysis and quantification of TCA in human urine. The automatic screening function of the main parameters provided excellent resolution and peak intensity for the four TCAs in this study group. After a slight adjustment of the selected gradient conditions, the final total run time was 3 min, and urine samples were extracted from the Oasis WCX 96-well μElution plate. The recovery rate of TCA extracted from human urine ranges from 92% to 104%. The concentration of the simplified standard curve solution ranged from 0.1 to 10.0 ng/mL, and the points on the curve were linearly distributed with an average accuracy of 99%. Each analyte has an LLOQ of 0.1 ng/mL, which is sufficient for bioanalytical requirements.
Overall, this application note demonstrates the practicality and application advantages of UPC 2's new separation technology in this important application area of ​​bioanalysis. UPC 2 technology uses green CO 2 as the main mobile phase, samples can be directly injected without dilution or concentration, and the well-known orthogonality (for reversed-phase chromatography) allows the analysis of drugs in biological matrices. Quantitative aspects are highly appreciated.
And today, you can find lifelike sex dolls that fit everyone`s unique taste: big boobs, flat chested, blond, Asian, African, BBW, or a mature sex doll, to name a few. Or why not a beauty that`s a replica of your favorite pornstar!?
Favorite Sex Dolls,Popular Sex Doll,Popular Love Doll
Dongguan Chenkuang Biological Technology Co., Ltd , https://www.cksexdoll.com