Comparison of MS2 Quantification Method and SPS MS3 Quantification Method for TMT Marked Samples by Orbitrap Fusion
2023-07-16 09:09:42
Comparison of MS2 Quantification Methods and SPS MS3 Quantification Methods for TMT Marked Samples Using Orbitrap Fusion
Gu Peiming Li Jing
Thermo Fisher Scientific (China) Co., Ltd.
1 Introduction
At present, proteomics research has gradually shifted from traditional large-scale identification to targeted proteomics. The research content has been extended from protein identification to relative and absolute quantification of proteins. The most common application of protein relative quantification methods is label quantification, including : ICAT, DIART, ICPL, TMT, iTRAQ, etc., among which TMT and iTRAQ are the most widely used.
Traditional TMT and iTRAQ labeling experiments use MS 2 fragment reporter ions for quantification, but Steven P Gygi et al. found that this method is susceptible to matrix interference due to the parent ion screening process, so the quantitative results are lower than the actual values. This problem can be well solved by MS3 Fragment Reporting ions, which are based on the principle that the MS2 daughter ions from the fragmentation of the parent ion are used for characterization, while picking one or more of the highest strengths of the fragment ions. Fragment ions are further fragmented using HCD, and the generated reporter ions are used for quantification. Although the mass spectrum is susceptible to matrix interference when selecting the parent ion, most of the selected parent ions are the target parent ions, so MS2 Most of the ion ions with higher intensity in the ion are from the target parent ion. The reporter ions of these ion ions are selected for quantification, and the quantitative result is significantly better than the traditional quantitative method of MS2 fragment reporter ion.
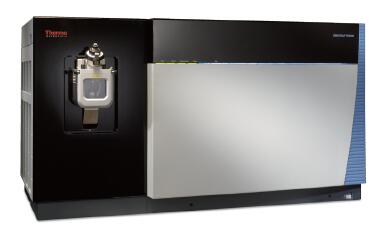
This paper mainly introduces the Thermostat's new generation of three-in-one high-resolution mass spectrometer Orbitrap Fusion using SPS MS3 quantitative method and MS2 quantitative method to qualitatively and quantitatively test TMT labeled samples, and the results obtained by the two methods are carried out. Comparison. The results showed that the MS2 quantitative method can identify and quantify more proteins than the SPS MS3 quantitative method, while the SPS MS3 quantitative method can identify and quantify more low-abundance proteins compared with the MS2 quantitative method, and the quantitative results are also More reliable.
2. Experimental part
2.1 Sample Information
The mouse DC cell line was treated with two different treatments, and the protein was extracted and digested with the control group. The TMT markers were 127, 130, 131, respectively, and the control group was labeled 127. After the labeling was completed, the three markers were used. The samples were mixed and graded using a pH 10, RP gradient to give a total of 16 fractions.
2.2 Experimental procedure
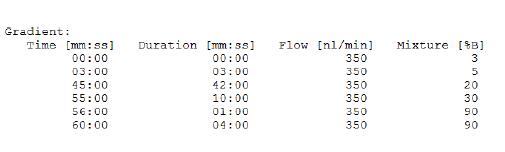
The samples were reconstituted with solution A (0.1% FA, H2O), loaded with 4.5 ul, separated by 60 min chromatographic gradients. The samples were qualitatively and quantitatively analyzed using Orbitrap Fusion. The mass spectrometry methods were quantified using traditional MS2 quantification methods and SPSMS 3, respectively. method.
2.3 Instrument conditions
2.3.1 High performance liquid chromatography conditions
High Performance Liquid Chromatograph: Thermo Scientific Easy-nLC 1000
Column: Easy-spray column (C18, 3 μm, 100 Å, 75 μm × 15 cm);
Load capacity: 4.5 μL
Mobile phase: A: 0.1% Formic acid in water; B: 0.1% Formic acid in Acetonitrile
Chromatographic gradient:
2.3.2 Mass spectrometry conditions
2.3.2.1 MS2 quantitative method
Mass Spectrometer: Orbitrap Fusion
Spray voltage: 2.1 kV
Capillary temperature: 275 ° C
S-lens: 60%
Collision energy: 40% HCD
Resolution setting: Level 120,000@m/z 200, Level 15000@m/z 200
Parent ion scanning range: m/z 350-1800; product ion scanning range: start
From m/z 100
Isolation Mode: Quadrupole
Data Dependent Mode: Top Speed
Cycle Time: 3s
Exclusion Time: 70s
2.3.2.2 SPS MS3 Quantitative Method
Mass Spectrometer: Orbitrap Fusion
Spray voltage: 2.1 kV
Capillary temperature: 275 ° C
S-lens: 60%
Data Dependent Mode: Top Speed
Cycle Time: 3s
Exclusion Time: 70s
MS1: Orbitrap
Resolution: 120000@m/z 200
Scanning range: m/z 400-1800
MS2: Ion Trap
Isolation Mode: Quadrupole
Activation Type: CID
Collision Energy: 30%
MS3: Orbitrap
Precursor Exclusion:low:30,high:5
Number of Notches: 10
Isolation Mode: Ion Trap
Activation Type: HCD
Collision Energy: 65%
Resolution: 30000@m/z 200
Scanning range: m/z 100-400
3 . data analysis
3.1 MS2 quantitative method
The raw file uses the Proteome Discoverer 1.4 software to search the Uniprot_mouse.fasta database (database number 10090) and the search results are stipulated by strict criteria (1% FDR).
3.1.1 Summary of identification results
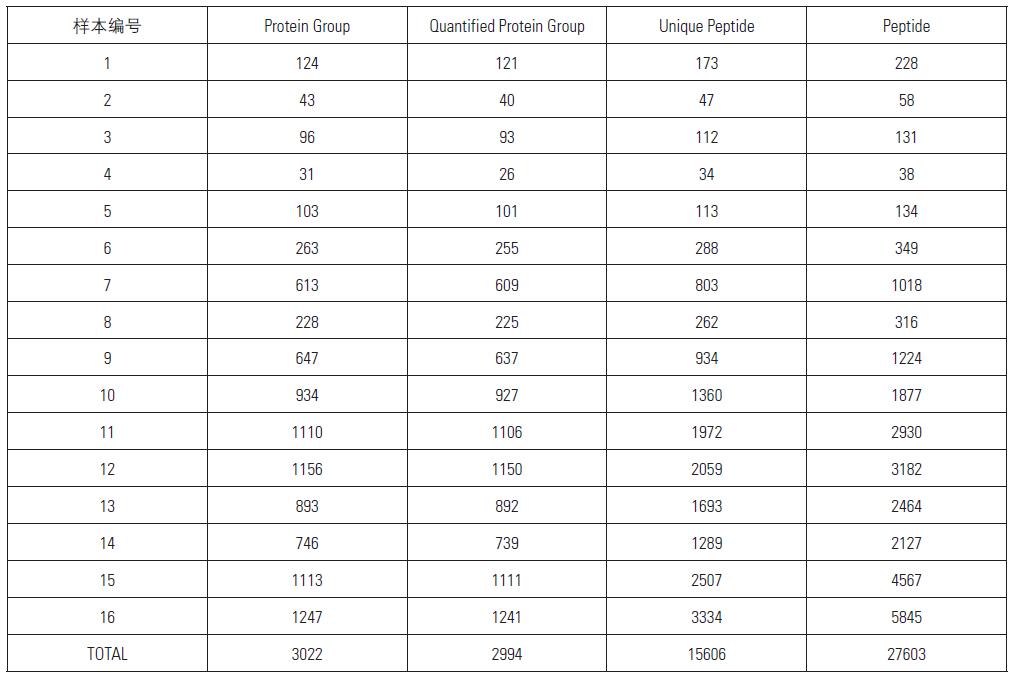
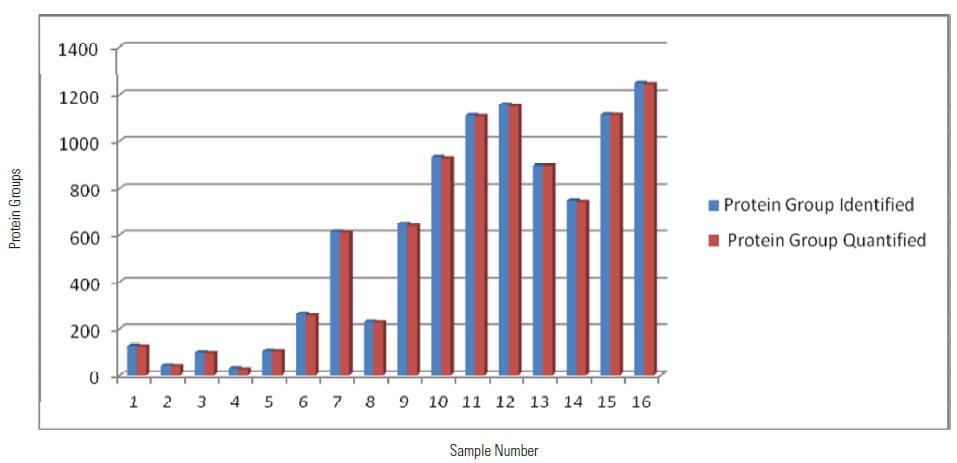
Distribution of Protein Group Identified and QuantifiedUsing MS2 Quantitation Method among 16 Samples
Distribution of Peptide and Unique Peptide Identified Using MS2 Quantitation Method among 16 Samples
From the above table and histogram, it can be seen that a total of 3022 proteins were identified within 16 hours, of which 2994 proteins have quantitative information (ie, 131/127, 130/127 have quantitative results), showing excellent Orbitrap Fusion. Qualitative and quantitative capabilities.
3.2 MS3 quantitative method
The raw file uses the Proteome Discoverer 1.4 software to search the Uniprot_mouse.fasta database (database number 10090) and the search results are stipulated by strict criteria (1% FDR).
3.2.1 Summary of identification results
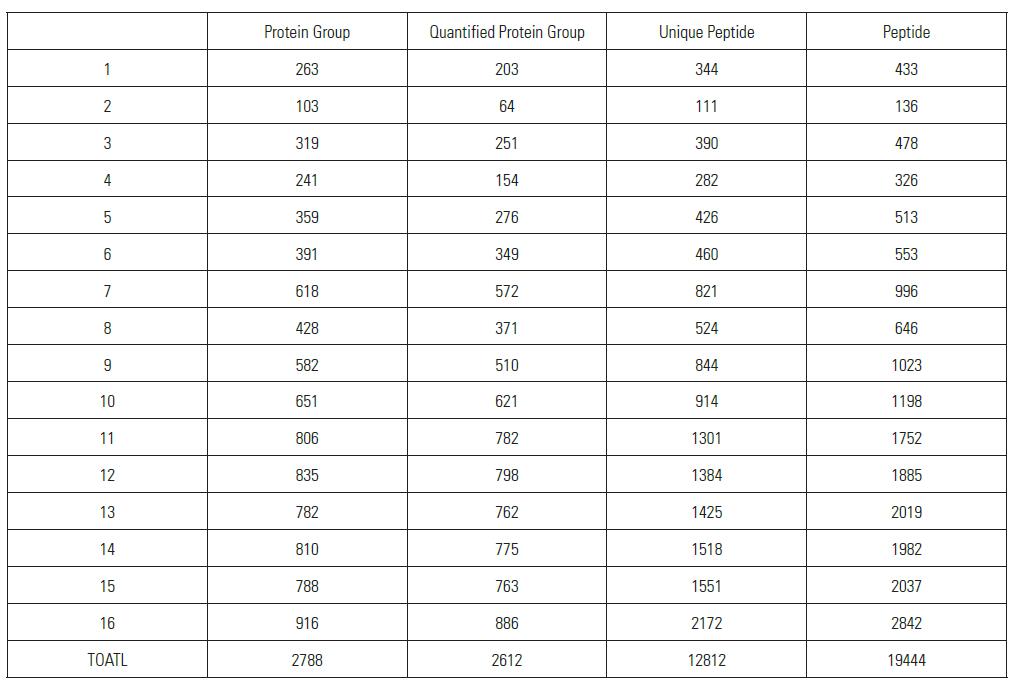
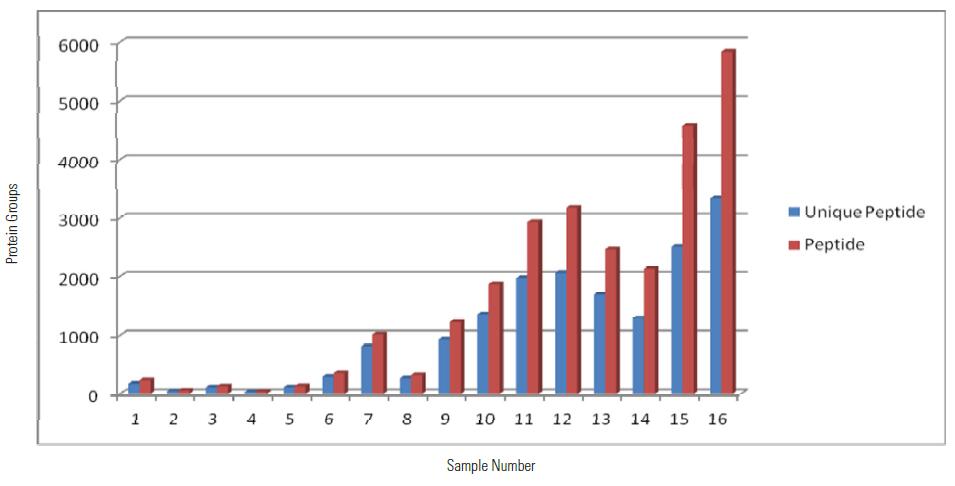
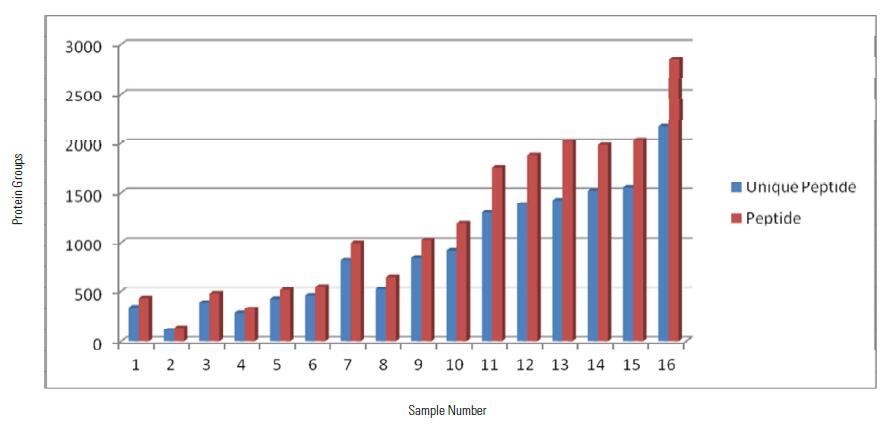
Peptide and Unique Peptide Identified Using SPS MS3 Quantitation Method among 16 Samples
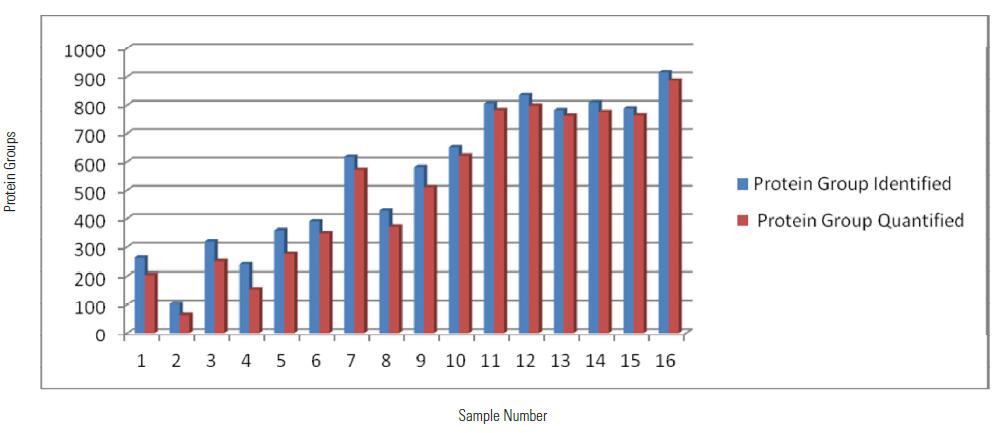
Distribution of Protein Group Identified and Quantified Using SPS MS3 Quantitation Method among 16 Samples
As can be seen from the above table and histogram, a total of 2788 proteins were identified within 16 hours, of which 2612 proteins have quantitative information (ie, 131/127, 130/127 have quantitative results), showing excellent Orbitrap Fusion Qualitative and quantitative capabilities.
4 . Comparison of MS2 quantitative method and SPS MS3 quantitative method
4.1 Comparison of qualitative and quantitative protein numbers
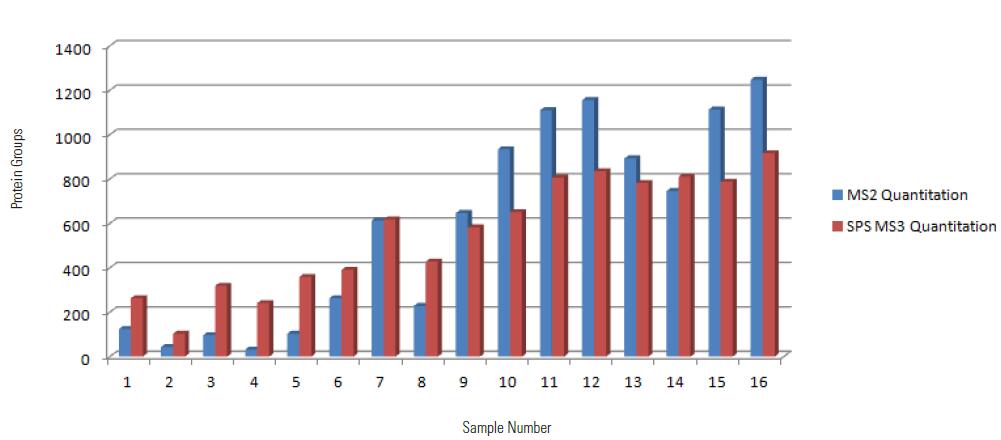
Protein Group Identified by Two Methods
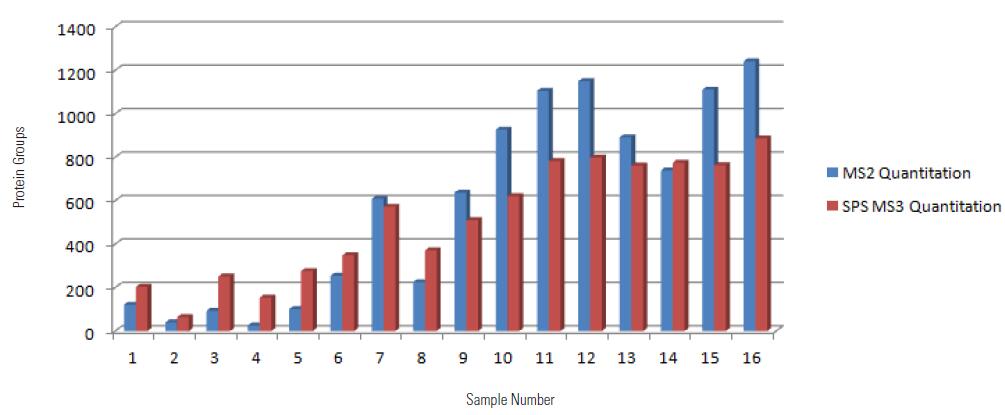
Protein Group Quantified by Two Methods
It can be seen from the above figure that the MS2 quantitative method is compared with the SPS MS3 quantitative method. The former has higher qualitative and quantitative protein numbers than the latter. Since the SPS MS3 quantitative method needs to fragment the parent ion in the IT, then select the fragment ion. To do SPS MS3, the acquisition speed will be slower than the MS2 quantification method, resulting in a slightly smaller number of qualitative and quantitative proteins.
In addition, in samples 1-7 and 8 it can be seen that the SPS MS3 quantification method can identify and quantify more proteins, although the SPS MS3 quantification method is slightly slower than the MS2 quantification method, but because of its protein characterization is Detection using an ion trap is more sensitive than Orbitrap, and
Quantitatively reported ions are the sum of the reported ionic strengths of the 10 fragment ions under high energy fragmentation, so the SPS MS3 quantification method can characterize and quantify more low abundance proteins compared to the MS2 quantification method.
4.2 Comparison of protein quantitative results
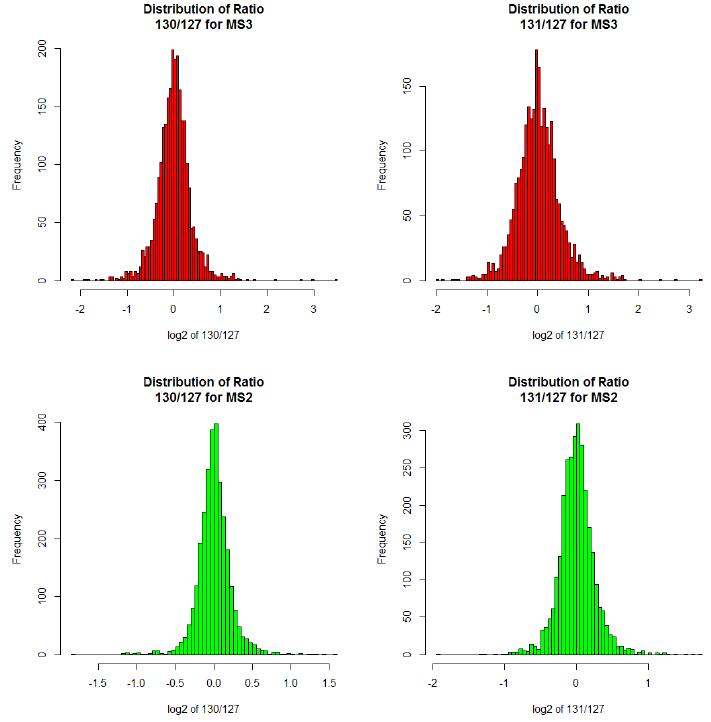
As can be seen from the above figure, the log2 value of the MS2 quantitative ratio is mostly between -1 and 1, while the log2 value of the SPS MS3 quantitative ratio is partially less than -1 or greater than 1, consistent with the literature report, MS2 due to The effect of matrix interference, protein quantitative ratio will be different from the actual value, the quantitative difference is small.
5. to sum up
In this experiment, the difference between the qualitative and quantitative protein numbers and the quantitative results of the latest high-resolution mass spectrometer Orbitrap Fusion using MS2 quantitative method and SPS MS3 quantitative method was compared. In the total detection time of 16h, the MS2 quantitative method identified a total of 3022. A total of 2,994 proteins have quantitative results, and a total of 2,788 proteins have been identified by SPS MS3 quantitative methods, of which 2612 have quantitative results. From the results, since the scanning speed of the MS2 quantitative method is slightly higher than the scanning speed of the SPS MS3 quantitative mode, the final result shows that the former can identify and quantify more proteins, but the SPS MS3 quantitative method can identify and quantify more. Low-abundance proteins, in addition, because the MS2 quantification method is susceptible to matrix interference, the quantitative differences are small and the results are not accurate enough.
NINGBO YOUHE MOTHER&BABY PRODUCTS CO.,LTD , https://www.oembreastpump.com